
Technical analysis in the stock market refers mainly to those chart patterns that help the indicators to understand when to exit or enter a trade, so as to gain a substantial profit. The indicators for tech analysis look similar to price information, but help in translating it into easy-to-read, simple signals, which help the investor determine the proper time of buying or selling.
One of the main goals of using technical analysis indicators is that it gives clues to the investors, which help them in interpreting the present market patterns and the possible future changes in price. So, using a combination of time, volume, and prices the technical analysis indicators end up maximizing the profits of a trader.
However, the relation between trading strategies and technical analysis indicators is much more complicated than that, and hopefully, you will get a clear idea about that at the end of this discussion.
The importance of technical indicators
Before we get into the nitty-gritty of the connection and the different aspects of how technical indicators and trading strategies are interlinked, let’s first take a look at the importance of these indicators in the world of trading.
Ensuring the right price forecasts
One of the main purposes of technical analysis is to aid investors in making a financially sound investment decision. There is no denying the fact that price is one of the key factors in determining the success of any stock market investment. The demand and supply of all the stocks depend on technical analysis. By a thorough evaluation of the history of the stock prices using the top technical analysis indicators, you will get an idea about how the future prices can look like for a particular stock.
At the time of analyzing the stock charts, you will be able to make price charts that aid in the determination of your next move. Using the tech analysis indicators, you will be able to recognize the given factors:
- Instability of the past and present stock prices
- The value and ability of stocks compared to the market scenario
- The stock value and price fluctuations after and before significant events
- History of trading and volume levels
Easily identifying the resistance and support level
By using the top technical analysis indicators for a stock chart, investors get to determine resistance and support levels. The levels help in defining the period of a bottleneck in the stock chart, in which the prices of the stocks tend to oscillate within a limited range for a particularly long time period.
When you get to recognize resistance and support levels, you get to make better decisions regarding whether you want to invest in a specific stock or not. When prices end up breaking the barrier, it means that the demand and supply are in a stable state.
Helps in timing the entry point
Another amazing benefit of technical analysis of the stock chart is that it aids in timing the entry points of the investors. Using technical analysis, you would know exactly the right time for your action. You will also be able to understand supply and demand levels, along with the breakouts, in order to make better decisions. Purchasing close to the support levels or having a breakout resistance aids in earning great returns on the investment.
Spotting the trends easily
When you invest in stocks, you need to be fully aware of the present market trends. By carrying out the analysis of the stock charts using the top technical analysis indicators, you will get know more about the long term and short term trends that help you in making informed investment decisions.
The Use of Technical Indicators for Developing Strategies
It will be wrong to mistake the indicators for trading strategy. The purpose of an indicator is to help the traders in the identification of the market conditions, whereas the strategy is the rulebook of a trader. The strategy dictates how the indicators are applied and interpreted for making calculated guesses regarding market activities of the future.
There are several categories of technical trading tools, such as volatility, volume, trend, and momentum indicators. Usually, the traders utilize multiple indicators for forming a strategy, although various kinds of indicators need to be used more than once. For instance, using three separate indicators of the same time results leads to multiple counting of information, which in statistics is known as multicollinearity.
This is something that has to be avoided because it gives you redundant results which can make several variables seem less important. Instead of that, the traders have to select indicators from various categories, like one trend indicators and one momentum indicators. Usually, one of the indicators is used for the purpose of confirmation, which is for making sure that another indicator is giving the right signal.
For instance, a moving average strategy may use the momentum indicator for confirming that there is a valid trading signal. RSI is a momentum indicator that compares the average change in the price of the advancing periods besides the average price changes noticed in the declining periods. Like the other technical indicators, RSI also comes with user-defined variable inputs. This includes determining the levels which will represent oversold and overbought conditions. Thus, the RSI can be utilized for confirming the signals that moving average offers. Opposing signals in such cases indicate that the signal is not reliable and it needs to be avoided.
Every indicator combination and indicator needs proper research for the determination of the most useful application regarding the risk tolerance and the style of the trader. An important benefit of enumerating trade rules into the strategies is that it lets the traders use the strategy to past data to see how it might have performed in the past. This is a process called backtesting. It can’t be denied that it is not a guarantee of future results, but it does play an important role in developing a suitable trading strategy.
Varieties of Technical Indicators
Technical indicators play a critical role in determining the quality of trading done. As known by all, trading is primarily a speculative act which can only be anticipated and cannot be foretold. Hence, having instruments and tools that would provide ample idea of how to get the transaction done to earn more profit has always remained the focus of the market and its operators. The tools and techniques associated with the FX trading market are broadly categorized as top technical analysis indicators owing to their capacity to signal the upcoming behaviour of the market. Pie Charts, Graph charts, Statistical calculations are some of the popular methods that lead to an almost certain prediction of the market behaviour. Though the risk elements always lay ahead, the technical indicators surely reduce them to a great extent. Here are some of the technical indicators that help in judging and taming the FX market with ease and efficiency.
Role of Trend Indicators
Trend indicators can be referred to as the oscillators that keep on rolling between the high values and the low values of the market. If the fluctuations at all reflect any steady trend, the trend indicators help in detecting the same and routing the trading accordingly. Surely, with an advance forecast of the upcoming trends of the market, the traders acquire an advantageous position. This eventually benefits in trading actions and aids in realizing optimum profits out of every deal. Parabolic SAR, Moving Average Convergence Divergence (MACD), and parts of the Ichimoku Kinko Hyo are some of the frequently used varieties of trend indicators. When all or some of these indicators are applied correctly, the traders stand an opportunity to gain considerably.
Role of Momentum Indicator
Once you have detected the trends of the market correctly, it is time to understand the accuracy and intensity of it. If the trend is just a whim and is not going to last long, the trading decisions made on the basis of them would be ineffective. Hence, before you finalize your move in the market, it is essential that you judge the possibility of sustenance of any trend. Momentum indicators are especially effective in deciding the bottom and the tops of the prices in the market. Relative Strength Index (RSI), Average Directional Index (ADX), Stochastic, and Ichimoku Kinko Hyo are some of the top technical analysis indicators that help in maintaining a balance between the trends and your decisions.
Role of Volume Indicator
Price fluctuation in the trading market is a common phenomenon. What makes it impactful is the volume associated with any such move. Here comes the relevance of the volume indicators. They provide traders with an intense understanding of the entire matter. It also indicates the strength of any price change in the market. On-Balance Volume, Klinger Volume Oscillator, and Chaikin Money Flow are some of the instrumental indicators used by traders. Proper and strategic application of these indicators leads to the realization of substantial profit.
Role of Volatility Indicator
The trading market receives it’s identity from its volatility feature. Since the market works on speculations, volatility comes hand in hand. Being a trader, an idea of the extent of the volatility of the market is always essential. Stable prices are not a signal of a well functioning market. A small change in the price level can be associated with low volatility in the market. However, it seldom stands in favour of the traders. On the flip side, the prices would change drastically only if the volatility is high and the same can be instrumental in making some major profits. Hence, volatility indicators allow the traders to comprehend the price movements and judge them properly to the health of the business. The Bollinger Bands is an efficient volatility indicator that helps in gaining more out of a volatile market.
The top indicators for best profits
Earning profit remains the primary motto of every trader. With obstacles like speculation, volatility, unpredictability and many others, the trading market mostly remains a challenging platform to reap profits out of it. One wrong move or judgment can result in a substantial loss in the overall trading. Here are some of the top technical analysis indicators that make the process smoother and hassle-free.
Bollinger Bands
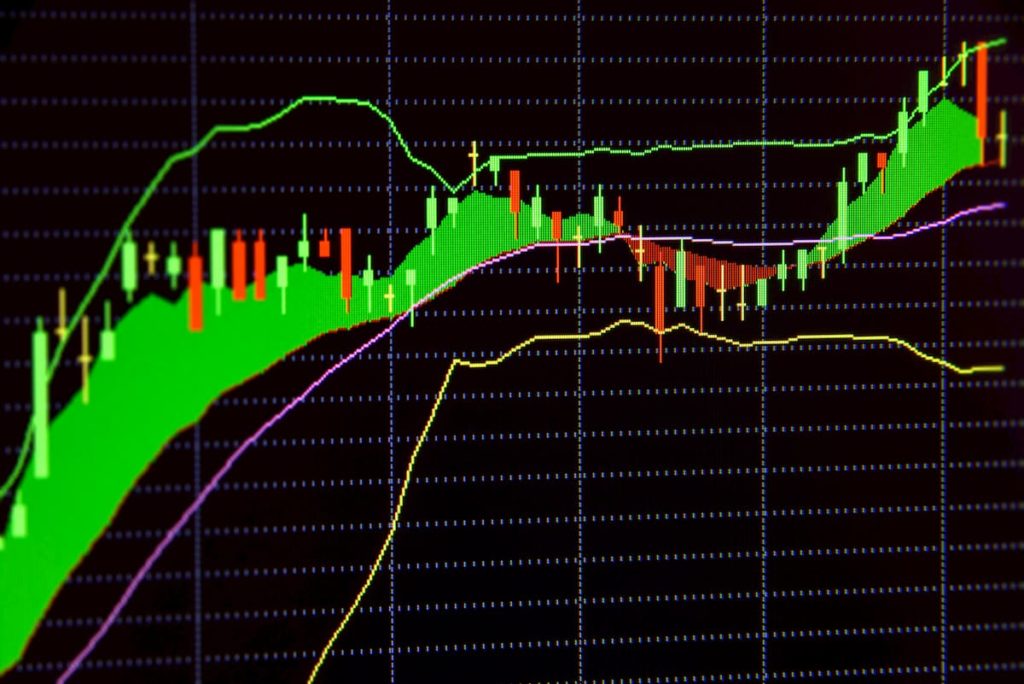
One of the best indicators to assess the movement of the market is this Bollinger Bands. As the name suggests, the indicator works on the principle of band formations. Two lines get plotted at two standard deviations on both sides of the average line that moves centrally. A narrow band is an indicator of a quiet market and the wideband represents a happening market with greater potentials. The band features an upper edge and a lower edge. When the prices touch the upper edge, selling should be the activity undertaken. Whereas prices settled at the bottom layers indicate the right time for purchases. If the prices break through the bottom edges, the trend generally remains downwards. A clearer picture is generally obtained by studying the bands properly through Bollinger bands.
Ichimoku Kinko Hyo
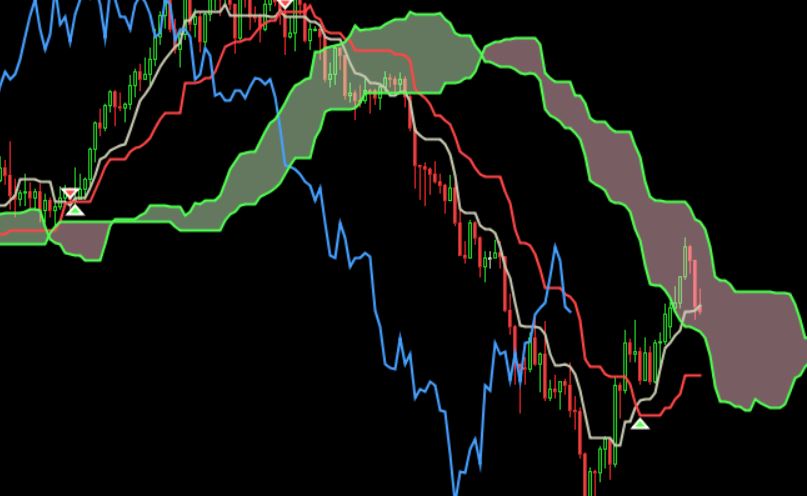
If understanding the future price momentum and the areas of resistance and future support is what you are looking for, Ichimoku Kinko Hyo is one of the top technical analysis indicators that you have at your disposal. It represents the results through plotting lines on a chart. The blue lines on the chart are called Kijun Sen or the standard lines which are derived through averaging the lowest low and the highest high prices registered over26 previous periods. The red lines stand for the averages of the last 9 periods. The green line represents the current day closing price plotted behind 26 periods. The red and blue lines form a span and the highest high and lowest low records shape another span. These spans indicate the direction of movement and the strength of the price changes.
Relative Strength Index
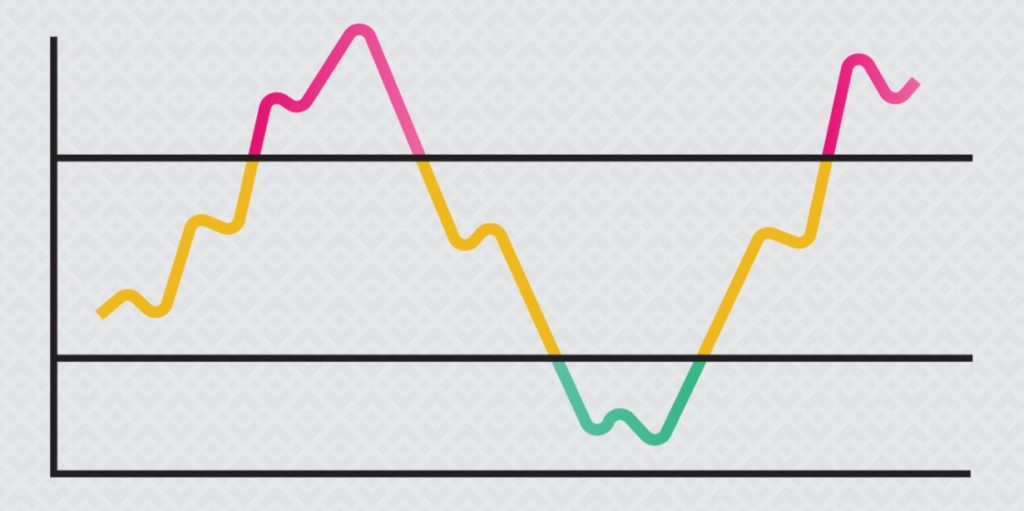
This variety of indicator also belongs to the momentum group of indicators. It is plotted on a different scale. Like some other top technical analysis indicators, this one illustrates overbought and oversold situations through a single line-scale depicting 0 to 100 scale range. Here, below 30 means oversold market whereas a reading beyond 70 signifies an overbought market. It allows a span in which the market seems to remain stable. Hence, it also allows the traders to comprehend the trends prior hand and make their moves accordingly to nullify the chances of entering the market at the wrong time. It signals the time when buying and selling should be done. Trend formations are confirmed through this indicator. If avoiding risk is on your mind, this indicator can be of much help.
Moving Average Convergence Divergence
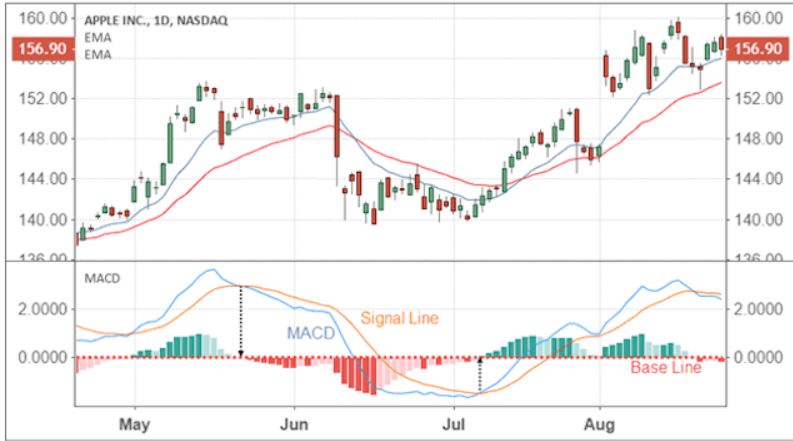
Composed of a fast line, a slow line and a histogram, this is a variant of the trend indicators. Moving averages of different references are put together to derive the results here. The MACD fast line is calculated based on MA fast and MA slow averages. The slow line is derived from the MACD fast line. The histogram represents a difference between the fast and slow lines. These lines, when plotted on a chart, tend to crossover each other at times. The lines approaching a crossover have a converging tendency whereas the lines drifting away from the crossover point reflect diverging tendencies. Emerging trends are represented by the converging lines and the diverging lines show the reverse trending effect.
Parabolic Stop and Reverse
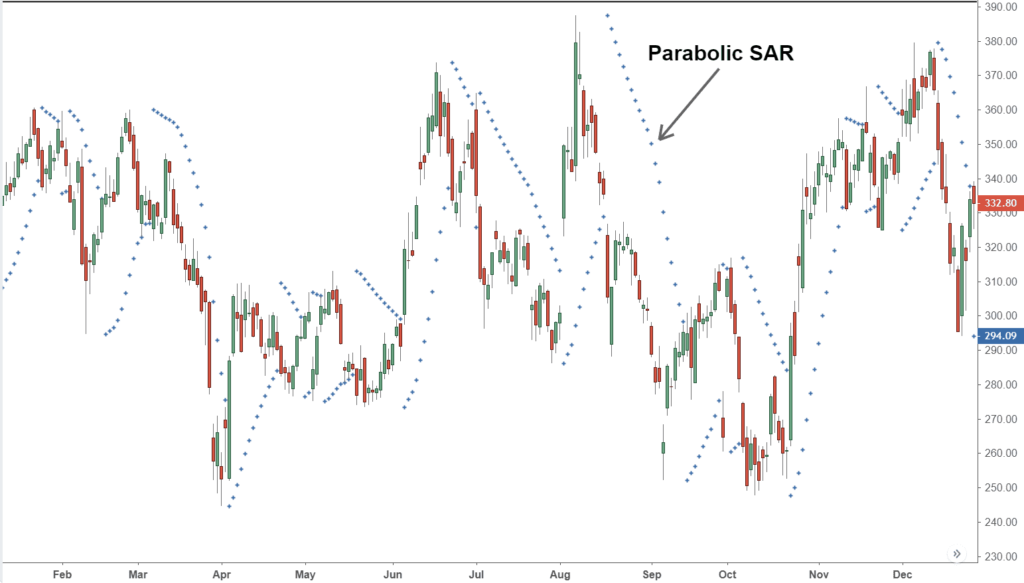
This variety of indicator is much simpler than the former. This is also a trend indicator. With respect to every price, dots are mapped on the chart either above or below the price bars. The dots denote the possible direction of movement of the prices. So, when the dots are placed over the price, the market can be considered to be experiencing a downtrend. On the other hand, dots placed under the price bars indicate the market is experiencing an uptrend. Though not fit for ranging markets, this indicator can be used to analyze the simpler moves of the market.
Stochastic
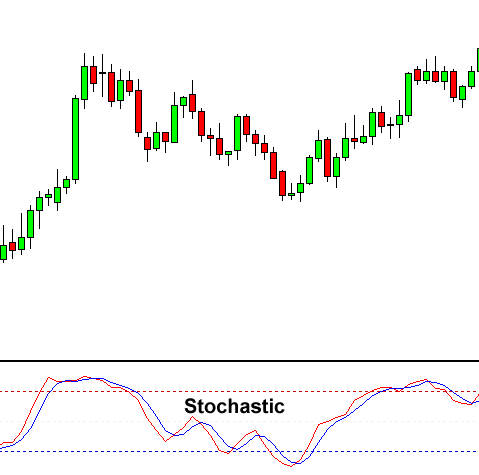
This is another variety of momentum indicators. It allows the trader to comprehend the end of an existing trend in the market. Two lines plotted on different charts from the groundwork for this indicator. It is highly effective in deciding the right time to enter the market to experience the benefits of a new trend. Beyond the mark of 80, the market will start showing downward trends indicating no signs for further entrants.
Average Directional Index
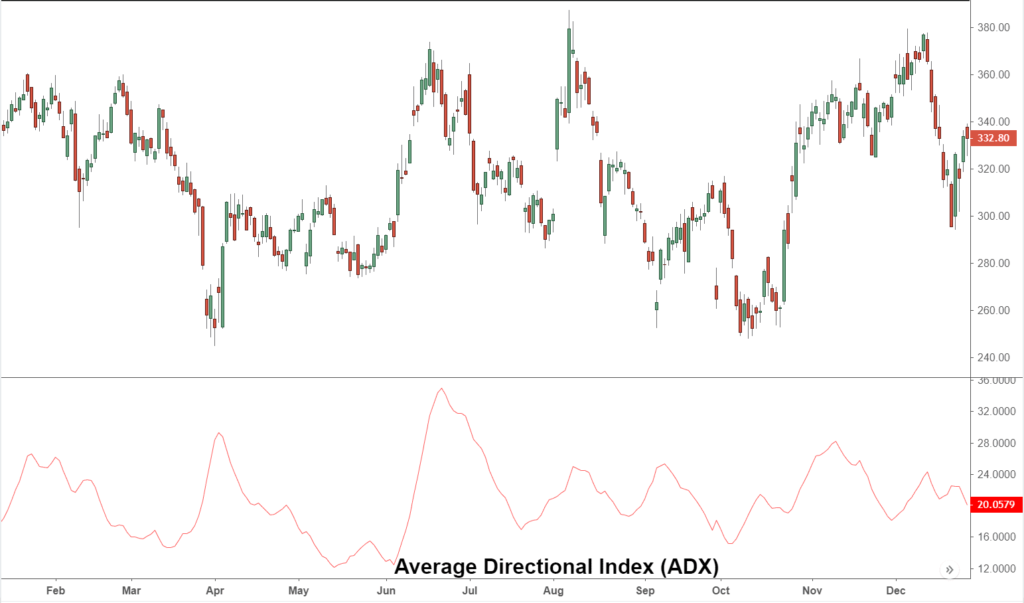
This is a trend indicator but an oscillator at the same time. It signals the strength of a trend ranging between 0 to 100. Any value under 20 indicates a weak trend ad any value beyond 50 indicates a strong trend. This indicator does not allow detection of the direction of the trend, it only indicates the strength of the trend.
Conclusion
To make the best out of your trading actions, use all of these or some of these indicators together to get a clear picture of the scenario. This will help you in making a profitable business out of every move.