
Relative Strength Index – Formula
RSI is calculated using the following formula:
RSI = 100-(100/1+RS)
Relative Strength (RS) = average of x days up closes/average of x days down closes.
This RSI calculation is based on the default suggested by Wilder; that is, 14 days. Losses are denoted as positive values rather than negative values.
The first calculation for average gain and loss are based on the 14-period average:
· First Average Gain = Sum of gains over the last 14 periods/14.
· First Average Loss = Sum of losses over the last 14 periods/14.
The consequent calculations are based on previously calculated averages and the current gain loss:
Average Gain = [(Previous Average Gain) x 13+ current gain]/14
Average Loss = [(Previous Average Loss) x 13+ current loss]/14
The core idea of Wilder’s formula is to normalise the relative strengths and transform it into an oscillator that goes between 0 and 100. The line of RS seems identical to the range of RSI. Normalisation of RS makes it easier to detect extremes because RSI is range-bound. When the average gain sums up to zero, the RSI also turns to zero. Keeping the 14-period RSI in mind, a zero RSI value implies prices transit lower throughout all 14 periods, and there are no gains to calculate. RSI reaches 100 when the Average Loss sums up to zero. This means prices move higher throughout the 14 periods, and again, there are no losses to calculate.
Significant Features of the Relative Strength Index
Following are some prominent features associated with RSI:
1. Momentum Indicator:
Momentum indicators are typically defined as technical tools that are used to measure the speed of market price movements. Primarily, they are used to monitor shorter-term security and offer indications of sustainability of the particular security’s movements by extending oversold and overbought signals.
2. Oversold vs Overbought:
Oversold and overbought are the two primary terms used in trading with the RSI. Therefore, it is essential to understand the meaning and the difference between these two critical concepts.
- Overbought
Overbought is the term used to refer to a time period that shows a consistent upward trajectory with regards to a particular stock; devoid of much pullback. In simple terms, overbought indicates a rise in stock value without too many downs. However, in the continuously fluctuating trading world, it is unlikely for stock to remain up for too long without experiencing any falling.
- Oversold
The term oversold indicates a time period with a consistent downward trajectory in a particular asset’s price. However, it cannot be completely assured that the stocks that are performing badly today may not have room for improvement tomorrow.
Typically, below 30 is determined as oversold in RSI and above 70 is considered overbought. Additionally, the range of 30–70 signifies no trend or neutral.
3. Parameters
On a regular basis, the default setting for the RSI is kept at 14. However, one can change this value to increase or decrease the sensitivity based on the requirement. When RSI reaches 10-day, it indicates overbought, and when it hits 20-day, it is a sign of oversold levels. Furthermore, the look-back parameter also relies on the volatility of a particular security.
RSI is considered to be overbought when it reaches over 70 days and oversold when it goes below 30. Increasing the overbought to 80 or decreasing the oversold to 20 will reduce the final overbought/oversold readings.
4. Divergence
Divergence indicates a potential reversal point as, at this point, the directional momentum doesn’t confirm the price. There is an occurrence of substantial divergence when the particular security makes a lower low, whereas the RSI forms a higher low. Additionally, RSI doesn’t verify the lower level, and this indicates reinforcing momentum. A rather surly divergence is created when a security records a higher high, and the RSI forms a lower high. RSI again does not confirm this high, hence showing weakening momentum.
5. RSI Range Shift
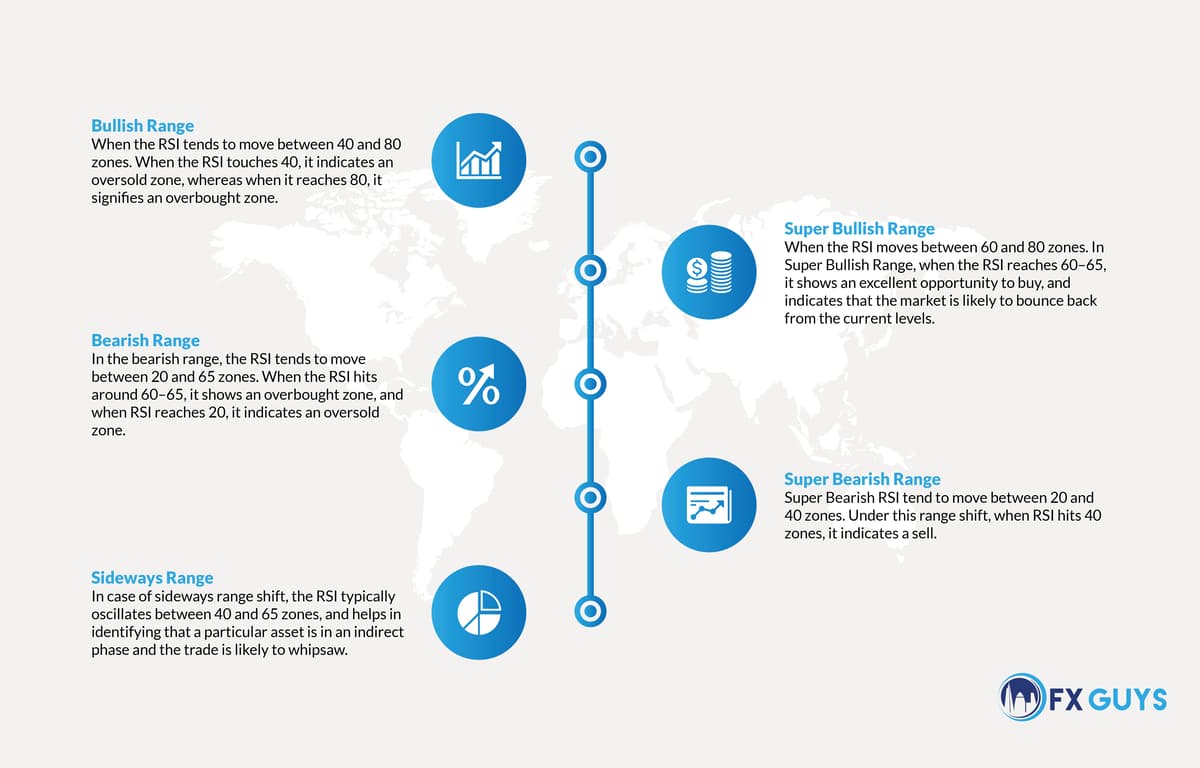
RSI range shift is a concept that occurs when the indicator moves from a set range to another range in response to movement in the price of a particular asset. These movements typically indicate a shift in the existing trend; therefore, helping traders take a proactive step and increase their probability of generating more profits. The following are five types of RSI ranges:
· Bullish Range – When the RSI tends to move between 40 and 80 zones. When the RSI touches 40, it indicates an oversold zone, whereas when it reaches 80, it signifies an overbought zone.
· Super Bullish Range – When the RSI moves between 60 and 80 zones. In Super Bullish Range, when the RSI reaches 60–65, it shows an excellent opportunity to buy and indicates that the market is likely to bounce back from the current levels.
· Bearish Range – In the bearish range, the RSI tends to move between 20 and 65 zones. When the RSI hits around 60–65, it shows an overbought zone, and when RSI reaches 20, it indicates an oversold zone.
· Super Bearish Range – Super Bearish RSI tend to move between 20 and 40 zones. Under this range shift, when RSI hits 40 zones, it indicates a sell.
· Sideways Range – In case of sideways range shift, the RSI typically oscillates between 40 and 65 zones and helps in identifying that a particular asset is in an indirect phase and the trade is likely to whipsaw.
6. Failure Swings
Failure swings are considered a strong indicator of a looming reversal. They are independent of price action and solely rely on RSI for signals. A strong failure swing forms when the RSI moves under 30, leaps above 30, pulls back, stays above 30, and eventually breaks its high. It is a move to oversold levels and, subsequently, a higher low above oversold levels.
Furthermore, a weak failure swing is formed when the RSI goes above 70, comes back, bounces, fails to move over 70, and eventually breaks its initial low. It is a move to an overbought level that is followed by a lower high beneath the levels.
7. Trend ID
In the famous book, the Technical Analysis for the Trading Professional, Constance Brown states that oscillators do not move between 0 and 100. She identifies the range of the bull market and bear market for RSI, which tends to vary between 40 and 90 in a bull market where 40–50 zones act as a support. These ranges are subject to variation based on the parameters, trend’s strength, and the precariousness of the primary security.
On the other hand, in a bear market (downtrend), the RSI tends to fluctuate between 10 and 60, wherein 50–60 zones act as a support.
8. Positive Reversals
The positive and negative reversal was developed by Andrew Cardwell. His concepts stand the exact opposite of bearish and bullish divergence. He considers bearish divergences to be bull market (uptrends) and bullish divergences to be a bear market (downtrends).
Basically, a positive reversal forms when the RSI shows a lower low and the main security indicates a higher low. However, it is not at oversold levels; rather, it stands between 30 and 50. A negative reversal, on the other hand, occurs when the RSI forms a higher high and the security shows a lower high. The higher high is typically just below overbought levels – between the 50 and 70 area.
Relative Strength Index in Foreign Exchange Domain
RSI is primarily used to indicate overbought or oversold conditions in a particular market. An intraday foreign exchange trading can be formulated to leverage the potentials of valuable indications derived from RSI.
RSI is an important technical indicator, and a momentum oscillator that signifies a particular asset is overbought when the RSI value moves over 70 and shows an oversold condition when RSI forms under 30. Furthermore, it is an ordinary occurrence for the price to continue to increase beyond where the RSI first shows the market as being overbought or oversold.
As mentioned above, J. Welles Wilder recommends a period of 14, which can be adjusted by the analysts according to their distinctive purposes. RSI is denoted as a universal indicator that can be effectively leveraged for the objective of trading any asset at any time-frame.
While the RSI can show whether you are moving towards a profitable deal, it doesn’t verify every aspect of trading. RSI indicates that particular security is overbought or oversold; it doesn’t imply that it will not move up or down in the near future. RSI is merely an indicator that can help you identify potential trend reversals.
How to Set Up and Use RSI in Trading
The following are steps that will help you set up RSI in your existing trading platform and use it to identify the trends associated with your assets:
- Click on the “indicators” in the bottom left corner of the trading platform.
- Click on the “Popular” tab and select “RSI” from the list of indicators.
- Click on the “Apply” button if you wish to proceed with the standard settings. Post selecting “Apply”, the RSI graph will be displayed in the bottom of the screen.
- Traders can also set up the RSI according to their trading preferences prior to selecting “Apply.”
Alternate Settings
While setting the indicator, traders have the option to adjust the period for overbought/oversold levels in order to acquire better accuracy and sensitivity. The wider the corridor, the fewer the chances to get signals; however, they will be more precise. On the other hand, if threshold levels are closer to one another, the crossover signals will come across more often. However, there will be a higher probability of false indications. Additionally, as the period parameter increases, the indicator becomes less sensitive.
The Conventional Approach of 70/30
In the standard approach, the period of 14, the overbought level of 70% and the oversold level of 30% are kept. This is the most commonly used preset for RSI. The RSI in the conventional approach tends to bounce between the threshold lines of 30 and 70.
The Conservative Approach of 80/20
In the case of the conservative approach of 80/20, the period of 21, the overbought level of 80%, and the oversold level of 20% is kept. Investors who want to mitigate the chances of risk set the indicator in a manner to make RSI less sensitive and therefore reduce the number of false signals.
The Divergence
Divergence is another approach to set up customised RSI. If the movement of primary assets is not confirmed by the RSI, it can indicate an alteration in trends. It can be considered a good indicator for upcoming price reversals.
Tips to Use Relative Strength Index Effectively
The tips below will assist the analysts to effectively use RSI in their trading activities:
· There is More to RSI Than Crossovers
Initially, when traders work with RSI, they often tend to focus merely on overbought and oversold values. Although they are imperative aspects to enter in the market, these can also turn out to be counterproductive in a competitive trending environment. RSI is one of the prominent momentum oscillators; this means that existing trends can keep overbought or oversold of RSI for a long duration.
· Monitor the Centre Line
Oscillators have a centre line, and often they are neglected when compared to the indicator itself. In the case of RSI, the scenario is no different. There is a centre line in the middle range at a reading of 50. Foreign exchange traders use this centre line to indicate alterations in the trend. If the RSI moves over 50, momentum is identified upwards, and traders can look out for buying opportunities in the market. However, when RSI drops below 50, this is an indication of a new bearish market trend.
· Verify the Parameters
RSI has defaulted to a setting of 14-periods. This implies that the indicators check the 14 bars on the graphs that they are analysing in order to create its reading. While 14 is the default setting, it doesn’t necessarily mean that it is the best for the trading. Generally, short-term traders use a smaller period of maybe nine or 10 periods RSI in order to signify shorter-term movements in the market. Longer-term traders opt for a higher period of maybe 25 periods RSI.
· Don’t Stick to One Source
RSI has its share of setbacks; therefore, traders should not completely rely on it. RSI should be used in combination with other effective technical indicator tools in the market. Furthermore, backing the trading activity with extensive research can also help traders make well-informed decisions.
· Determine the Entry and Exit Signals
Traders often use RSI as a definitive tool to determine whether they should invest in a particular trade. Rather, they should consider it a valuable approach to plan out effective entry and exit signals for stocks on their watchlist. If a particular stock is on one’s watchlist, then RSI can help in determining the right trading time.
· Identify False Signals
One of the important drawbacks of RSI is that it cannot entirely distinguish a divergence between price and momentum. For instance, a consistent uptrend or downtrend would keep the RSI over 30 or below 70. In this case, if the traders are waiting for an indication from RSI, they could end up being perplexed. This is why RSI should be used as one of the tools to make the trading process efficient.
Limitations of the Relative Strength Index
There are certain limitations associated with RSI that need to be highlighted. Similar to any other trading indicator, real market conditions may not always be in accordance with the technical indicators. Markets are extremely dynamic and, at times, irrational in nature. Moreover, technical indicators are only capable of indicating and not predicting. Similarly, RSI cannot inform traders when to enter or exit a particular trade. For instance, it can show that a stock is overbought at RSI 7; however, it cannot ascertain that the numbers will not go higher or lower in the future.
Trading Strategies with RSI
The following are some important tips that will help traders in a low-risk trading scenario:
- When RSI crosses the centre line from below, it is a strong indicator of trend movement. In this case, the traders can go high with their stock.
- When the indicator breaches the centre line from above, it implies that the average losses are surpassing the average gains. It indicates short selling or profit booking.
- When centre line crosses from centre itself, it can signify a good time to consider entry in a fresh pullback in price.
- When RSI trend continues to fall, the price trend consistently rises, and RSI is in the state of overbought, it typically indicates the occurrence of positive divergence.
- When RSI trend is upwards, the price is falling, and RSI is in the state of oversold, then it signifies the occurrence of negative divergence.
Important Advanced Trading Strategies Using RSI
The following are some advanced trading strategies used with RSI while trading in a more complex environment:
- Buy Signal
Buy signal is a state where RSI goes above 50 along with another indicator, such as moving average crossover, rise in volume, etc.
- Profit Booking
A profit booking state arises when the price candle is closed under Exponential Moving Average (EMA) or bearish crossover of EMA.
- Sell
Sell is a state when RSI stands below 50 along with a moving average crossover of EMA.
- Stop Loss
Stop loss is referred to as high of the previous candle. Basically, a stop loss is one candle before the sell signal candle.
Relative Strength Index vs Stochastic Oscillator
RSI and stochastic oscillator are both prominent price momentum oscillators that are harnessed to predict market trends. While both the indicators work with similar objectives, their underlying theories and methodology differ.
The stochastic oscillator was offered by George Lane. A stochastic is based on the assumption that closing prices should end near the same direction as the existing trend. The RSI developed by J. Welles Wilder Jr., on the other hand, monitors the oversold and overbought level by measuring the ongoing movements of price velocity.
Relative Strength Index vs Moving Average Convergence Divergence (MACD)
Moving Average Convergence Divergence (MACD) is another popular momentum indicator that showcases the relationship between two stirring averages of an asset’s price. The MACD is measured by subtracting EMA of 26 periods from the EMA period of 12. This calculation results in the formulation of the MACD line. Furthermore, MACD of 9-day EMA is referred to as “signal line”. This line is then placed above the MACD line that can be used to trigger, buy, and sell signals.
RSI is a popular technical indicator that offers traders various ways to formulate buy and sell signals. Automatic line crossover signals, as well as more visually sophisticated signals, are amongst them. RSI is also used to depict the general state of the particular market by determining where the market is oversold and overbought. The multiple ways to use RSI makes it an effective and flexible tool that can be used by traders to enhance the trading experience based on the prevailing market conditions.