
First Step: Study the Market Structure
If there is one flaw that exists with traders and their decision-making skills, it is their inability or negligence to read the market structure before making decisions. Understanding the market structure is basically flowing with the charts and getting a good read on how the charts are going to go. This is a simple and necessary skill that many fail to understand.
Even though the market structure is fundamental technical analysis, it is essential, and you need to take it seriously when making decisions.
For those wondering what market structure is, it is simply the interpretation of high and low points of price on the charts. To put it technically, it is the analysis of the combination of Higher Highs (HH) and Higher Lows (HL) as well as Lower Lows (LL) and Lower Highs (LH).
In this analysis, the order in which the highs and the lows move can help you understand where the market is moving to and where it will not. Once you know fundamental structure analysis, you find yourself thriving where other traders are struggling, allowing the price action to communicate to you if the market is:
- Emerging into a New Trend
- In a Bullish Trend
- Forming a Major Bottom to Top
- In a Bearish Trend
- Ranging Between Two Levels
Take-Home
By following the low points and swing highs on a price chart, you have the chance to build a solid foundation for your technical analysis. Many traders do not pay attention to market structure and find it challenging to analyse simple things such as where the market is moving to and when the market is trending; therefore, recording losses when they ought to be profiting.
Identifying Trending Structures
The task of identifying a trend is simple, but is often difficult for many traders, preventing them from improving their ability to read charts. Many even go as far as using complex or mathematical indications to tell when the market is trending.
I must say, this is a real waste of time and energy. You do not need any software or algorithms to tell you when the market is trending. All you need to do is follow this fast and straightforward rule: a trending market is a market making lower lows and lower highs or a market making higher highs and higher lows. This seems simple, but it is all you need to look out for to identify trending conditions. If you can identify this structure, you can identify a trend. You map out the swing highs and lows and connect them up.
Even with the effective nature of trends when it comes to making a profit, many traders make the mistake of entering out of position or trading in the wrong direction, so do not be a trader who chases price as it makes highs or lows because the next retracement will likely burn you out.
Take-Home
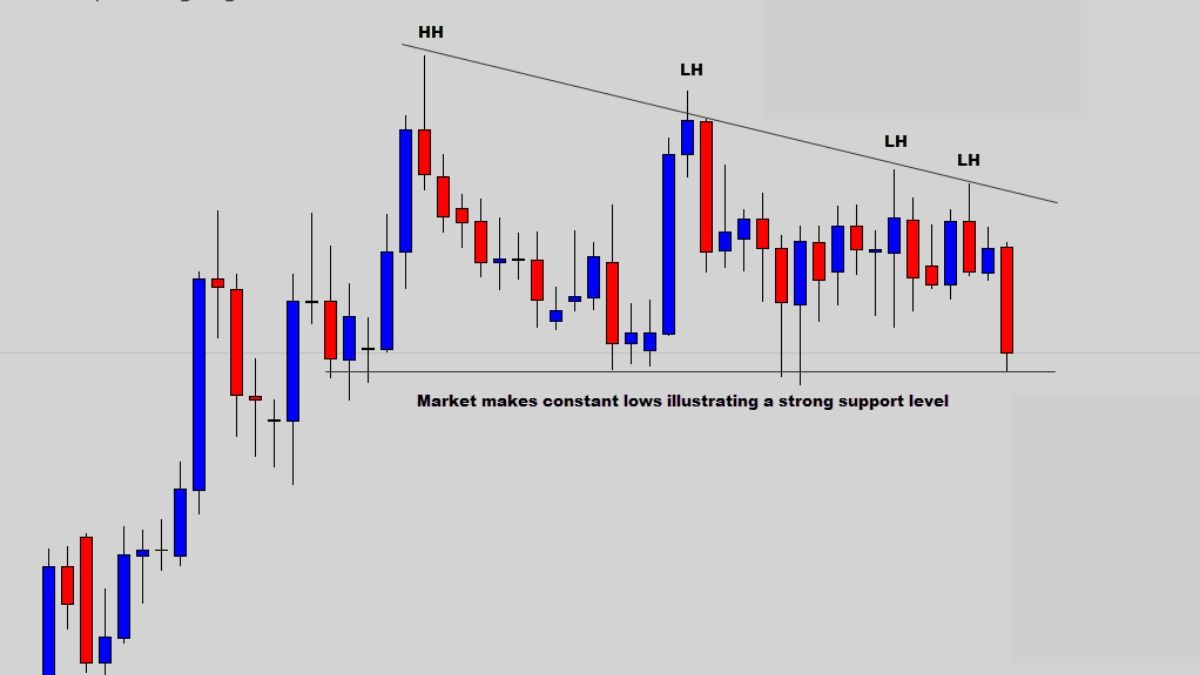
Trending conditions are identified easily by connecting swing highs and lows together, showing a stepping down or stepping upswing motion of the market. New lows are printed in a bearish trend while new highs are printed in a bullish trend. Use retracements into swing highs or lows to get into trends at optimal positions.
Ranging Market Structure
Ranging markets are more difficult to see at some times and really easy at others. The difficulty with ranging conditions is that it is an unpredictable market, which creates undesirable trading environments.
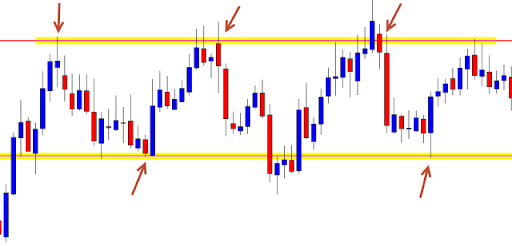
Under normal circumstances, ranging markets occur when the price is stable between two major levels, so you continuously see highs and lows at the same horizontal levels. However, the typical range structure rarely occurs in everyday markets. Ranges are unpredictable, not having clearly defined upper and lower boundaries, so you would have to identify a range using swing points that occur in the same area.
Now, because there is no clearly defined pattern, it makes it hard to identify reversal trades. Prices move randomly around range boundaries, which means you have to be cautious when trying to trade these ranging structures. If you see a clear range, you can use it, but if the range is too random to pinpoint, it is best not to trade with it.
Take-Home
Ranging market structures is pretty straightforward. All you have to do is highlight the highest and lowest swing points, which act as turning points for prices. However, be prepared for anything because ranges can get really random and use general areas as turning points for prices.
Unreadable Market Structure
Finally, on market structure, there is something we must not fail to mention; a big mistake many traders fail to pinpoint when trying to trade, which is the fact that sometimes, you cannot make sense out of all market conditions.
There are some irrational charts which are crazy with market structures you cannot make sense of. If you cannot understand the market and how things are going, the best thing is to leave it. Sometimes, there is no explanation for the price behaviour. Do not be a trader who wants to analyse an unreadable market structure; you will lose a lot of money in the process. Wait for the condition to change to a condition you can have confidence in when trading.
Take-Home
Whenever you see a market condition that does not make any sense to you, do not think it is your lack of experience at work; it is merely like that. If you cannot read a market structure properly, then do not trade with it.
Second Step: Identify Possible Turning Points
Apart from reading chart situations, another thing you should consider is the direction you want to be trading. This is where you have to predict the most likely place price is going to turn around. This is where technical analysis is set up using things such as trend lines and horizontal levels.
To build a case of high probability trade, you have to find logical points on the charts. Let us buttress this point using simple support and resistance analysis.
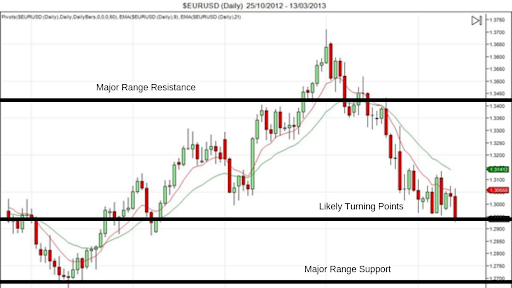
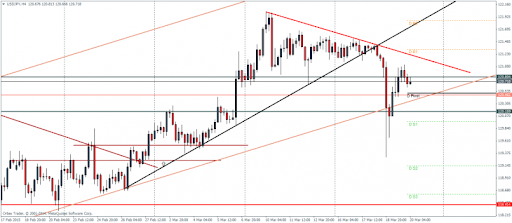
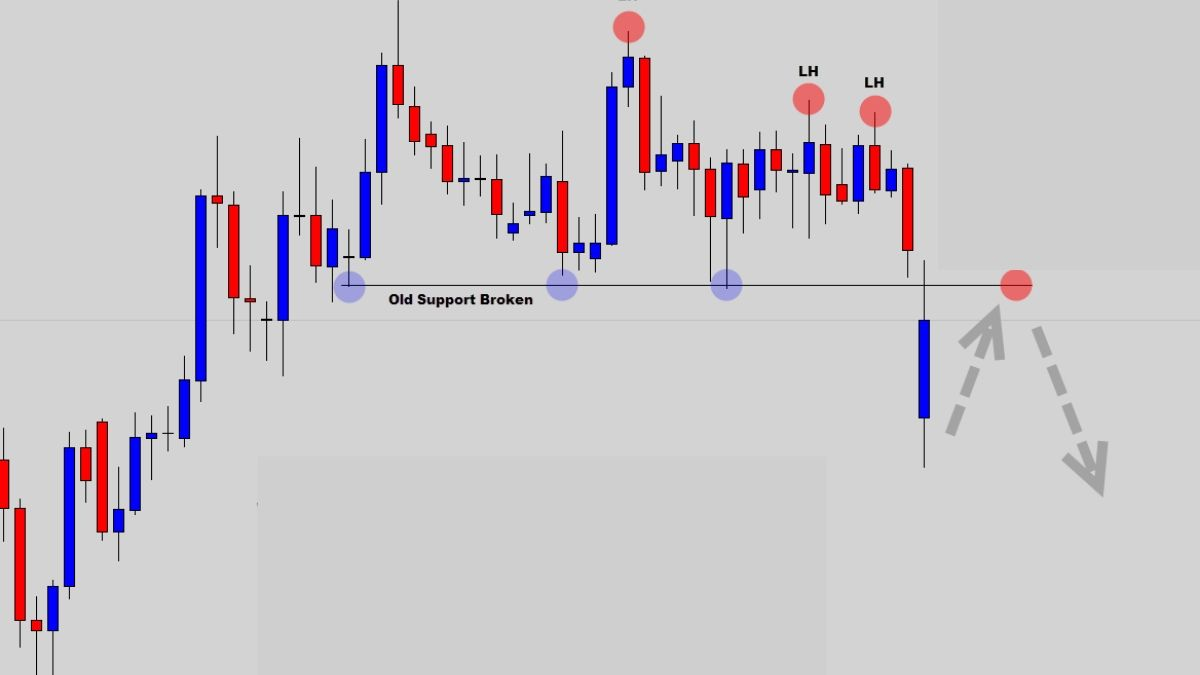
Using the above chart, you can identify market structures and use support and resistance levels to highlight possible turning points.
Now, even with the unpredictable nature of the forex market, there are two likely possible scenarios:
- The price will continue selling into the major range support levels where the price is most likely to turn around.
- Price would retrace into old support and use it as new resistance before reversing.
For example, the above chart shows how simple market structure and the technical analysis can help you start to master your chart reading skills. We identify the up-trending conditions as well as the important support and resistance levels to help you find the possible turning points. We can see from the chart that the current price position is in a bad position to consider buying into the trend, which is how traders lose their money by incorrectly trading trends. Once they see a trend up, they start buying, and this is called “buying out of position of chasing price”.
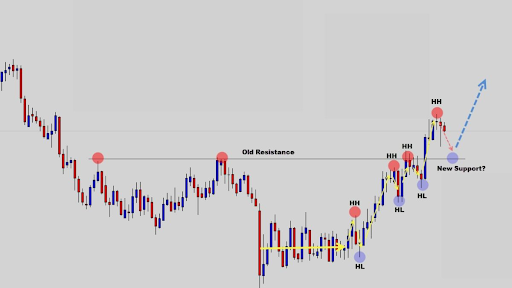
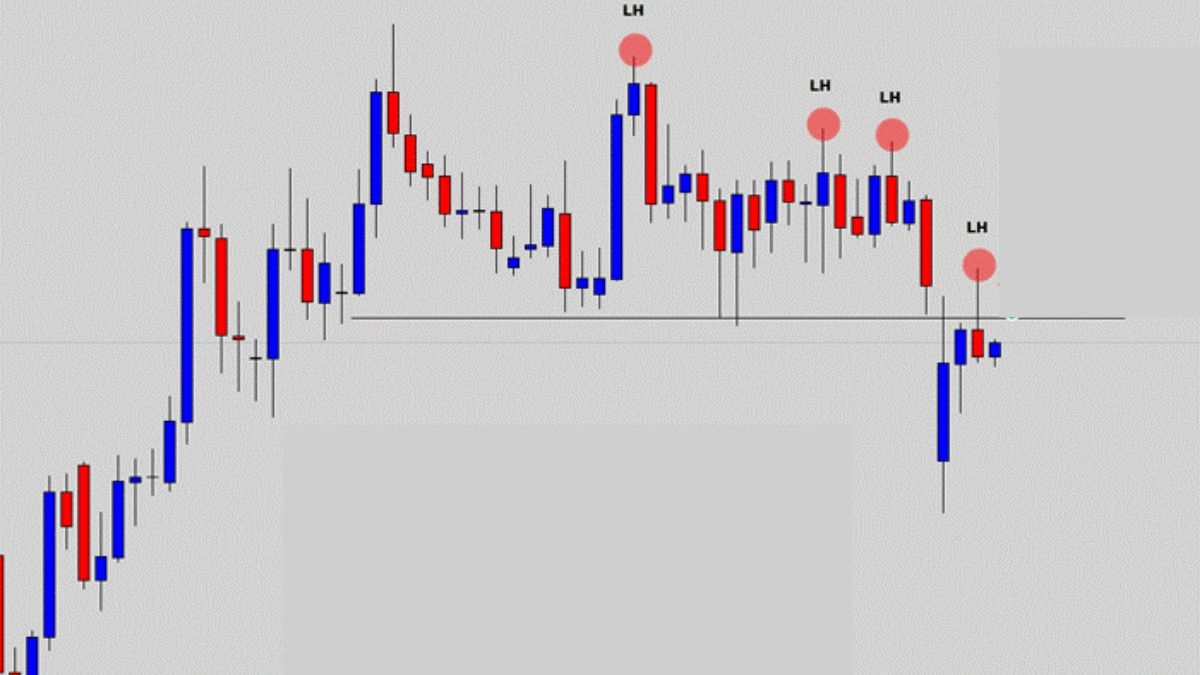
Following the previous step, which is studying the market structure, we will know that even though the price is up, it is likely to retrace soon into new lows. This means that if read correctly, you can use the trends retracement to your advantage and get into the trend at a smarter price. Sometimes, it does not make sense to use support and resistance levels, so you have to make use of a trend line from time to time. Don’t get carried away, though, as you sometimes need just one trend line on your chart to get the job done.
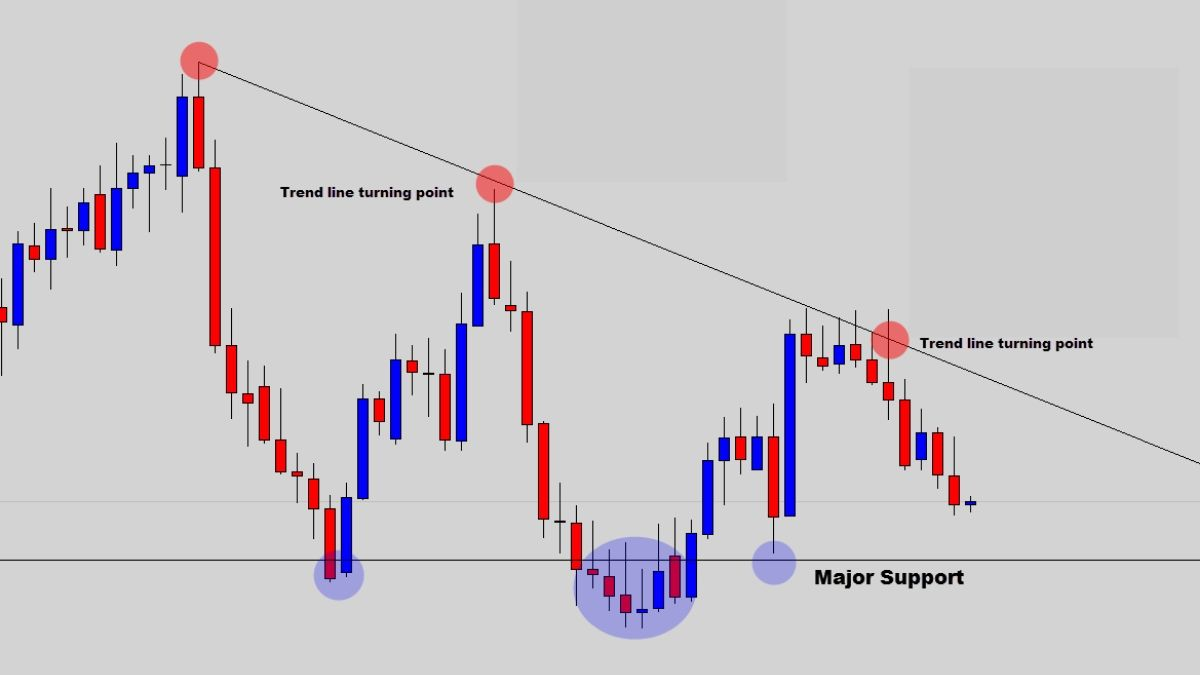
From the above chart, you can see that the declining trend line shows the main turning points as seen from the major swing highs taking lower highs every time. In fact, some of the price action sell signals off the trend line turning point turned out to be very profitable trades.
Take-Home
Some of your best sales are going to come from technical reversal points on charts. You, therefore, have to focus on obvious turning points and use your tools to mark the likely places the price is expected to reverse, giving you a better chance of trade success.
Third Step: Wait for a Trade Signal
The third and final step in trading forex with no indicators is waiting for a buy or sell signal from your trading organisation. This is most likely going to be in the form of a breakout catalyst pattern or a candlestick reversal system. The most popular candlestick signal is the Rejection candle, one of the best signals for learning to trade without the use of indicators.
To help you better understand all that has been said so far, we will use all the steps together with the Rejection candle as our trade signal. Here we go.
Read the charts properly following high and low swings. If you concentrate, you will understand where the chart is going. Once the breakout happens, and the chart is now in a position of promising price action, the next thing is to identify and mark out possible turning points to help you anticipate reversals.
This is a position of patience as you have to wait for the market to give you a signal, and when it does, you take action immediately.
After waiting patiently, we finally get our signal to sell, which is the last step to making a profit.
In this case, a rejection candle forms exactly where we predicted it would. To make the most of trading forex with no indicators, you have to know the basics and think less.
As a recap, you have to cross this checklist of three steps anytime you are trading without indicators.
- Make sure you read the market structure: if the market is trending down because it is making higher highs and lower lows, we know that we want to be sellers at this point.
- Identify possible turning points: using support and resistance analysis, we identify that a possible turning point would be the old consolidation support since it was a strong level. If it stays as resistance, it would likely reverse at that point.
- Wait for trade signals: here, the chart showed a Rejection candle, which is a common price action signal to sell. The use of the sell candle is a good idea because it is large in range with a close price below the open price.
This trade sample turned out well because consolidation breakouts create good moves if the market gives signals to get them. If you are not getting the best out of the forex market – which is frustrating by the way – you are most likely not using all these steps.
If you skip any of these steps in your analysis, here are some of the things that are likely to happen.
- If you neglect reading the market structure, you can enter a bad market and end up losing a lot of money.
- If you fail to identify turning points, you will most likely enter the market out of position like buying high or selling low.
- If you do not wait for trade signals, you will be blindly selling or buying, which can sometimes work. To be on the safe side, however, it is best to wait for a trade signal, which acts as a confirmation of the trade idea and also that your trade will end up profiting you.
So now that you know the importance as well as the consequences of using or neglecting these steps, make a checklist for each of these steps and use them to improve your trading. That way, you are guaranteed a higher chance of making a profit at whatever time you choose to trade.