

The Fibonacci Indicator Guide
Different types of Fibonacci levels and how to use them
In general terms, the Fibonacci indicator levels are based on a theory in mathematics commonly used, even outside financial analysis. When used for technical analysis, there are at least six indicators plotted on your chart with respect to the Fibonacci number formula.
In this article, we look to talk about some of the Fibonacci indicators used on the MetaTrader 4 and 5 trading platforms. After this, we are going to look at trading strategies that are the best for Fibonacci indicators.
Fibonacci levels and types
As we highlighted earlier in this article, the Fibonacci levels are based on a mathematical theory that can be used for technical analysis. The Fibonacci indicator makes use of this sequence – 0, 1, 1, 2, 3, 5, 8, 13, 21, 34, 55, 89, 144, etc. Each number you see in this sequence comes about as a result of adding the two previous numbers. If you divide any number of the sequence by the preceding number, you get a result of approximately 1.61, and this is the main ratio for the Fibonacci indicator.
The standard for price movements, such as the levels the price is likely to reach, as well as where it would reverse, are derived using the Fibonacci indicator. Based on the information obtained from these price targets, traders place stop losses, pending orders, and take profits.
Fibonacci levels are used to predict additional movements of the asset price. These indicators are tied to existing trends, as a rule, to help predict its extension or correction. In general, these Fibonacci levels perform the same function, with the only difference being the functioning principles and appearance.
Fibonacci levels
This is the most common Fibonacci tool used today. If you check it out on the charts, it looks like a grid made of several lines. The distance between these lines is calculated using the Fibonacci ratio. These lines are essential levels for price dynamics. Price tends to be attracted to these lines and suddenly reverses when approaching such a level. On the contrary, if the price breaks, it can be used as a signal of a strong trend.
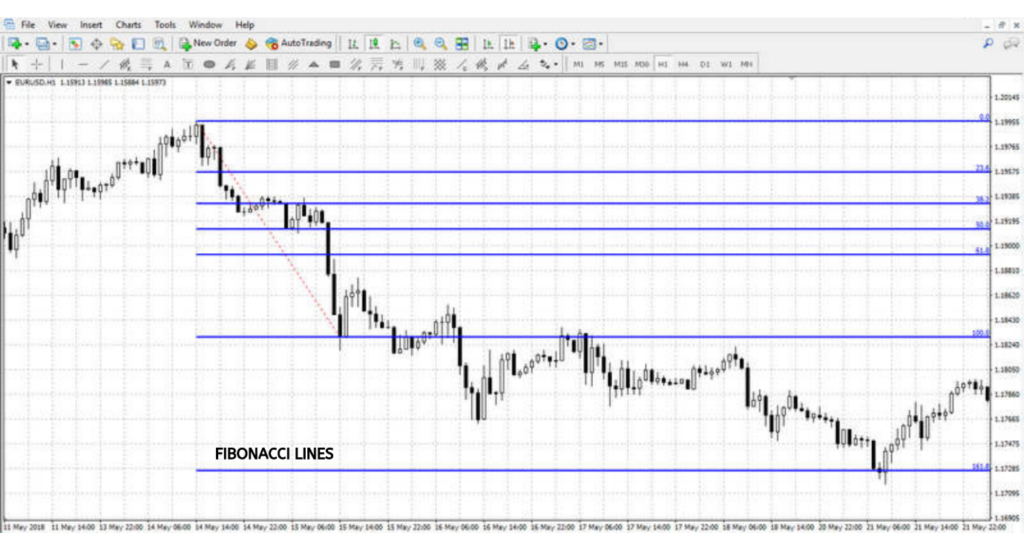
The last evident trend is the connection point of the Fibonacci lines. A grid is stretched from the start of the trend, which is level 0, to the end, which is level 100. Thus, the levels between this range become standards for likely levels, and reversals that come after 100 become targets for trend continuance.
When following a trend and opening an order, you can make your stop loss at internal levels and collect profit at external levels. When trying to trade retracements, you should set your price targets at internal levels. You can also open positions on a level breakthrough by simply placing pending orders.
Fibonacci time zones
The Fibonacci time zone is different from other Fibonacci tools as it allows you to predict the next wave formation time – trend or retracement – based on the duration of the previous momentum. Unlike Fibonacci lines, Fibonacci time zones are stretched from the extremum of the start of the trend to reversal points.
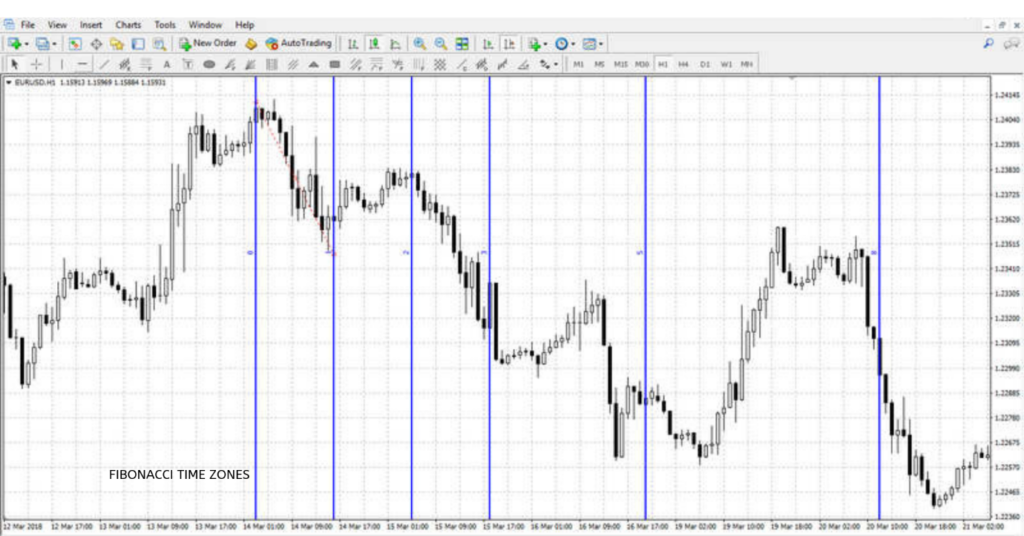
Unlike other tools, Fibonacci time zones are rarely used because each time frame has a wavelength that is different from others. This is because this tool does not provide accurate signals for entering a market at a specific price, making the placement of pending orders a non-option with this tool.
The Fibonacci channel
The Fibonacci channel is an upgrade to the Fibonacci lines. Unlike the Fibonacci lines, these channels are inclined, which allows you to form the grid of trend lines and determine the price targets, considering the angle of the trend.
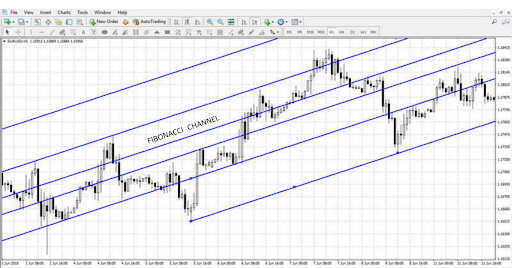
The Fibonacci channel is built based on two measures:
- If there is a downtrend, the indicator stays with the maximum levels.
- If there is an uptrend, the indicator stays with the minimum levels.
The first trend line, which becomes the primary support or resistance level, is based on the fact that you can adjust the position of the entire grid by moving the second line. To determine the retracements, you need to start pitching the channel against the direction of the trend from the second down to the first extremum.
Fibonacci arcs
The Fibonacci arc is one of the most effective tools whenever there is a flat price movement. It is useful for catching trend retracements, and, just like other Fibonacci indicators, the stretch points of the arcs are between the boundaries of a wave and a trend. However, these arcs can be built from the start to the end of a trend or vice versa.
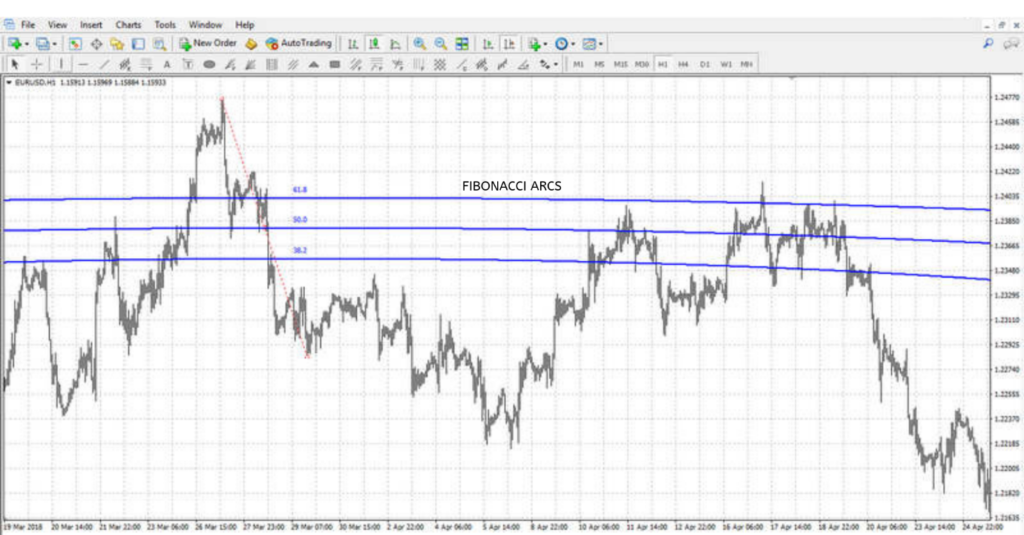
The standard version has just three arcs within the primary trend range. However, when there is a price movement away from important points, the lines deviate and expand the price target range to a certain level.
Fibonacci fan
This is another crucial Fibonacci tool, which we might compare to several rays that spread from one point to different directions. This stretch is based on two waves or trend points, starting with the initial point of the ray.
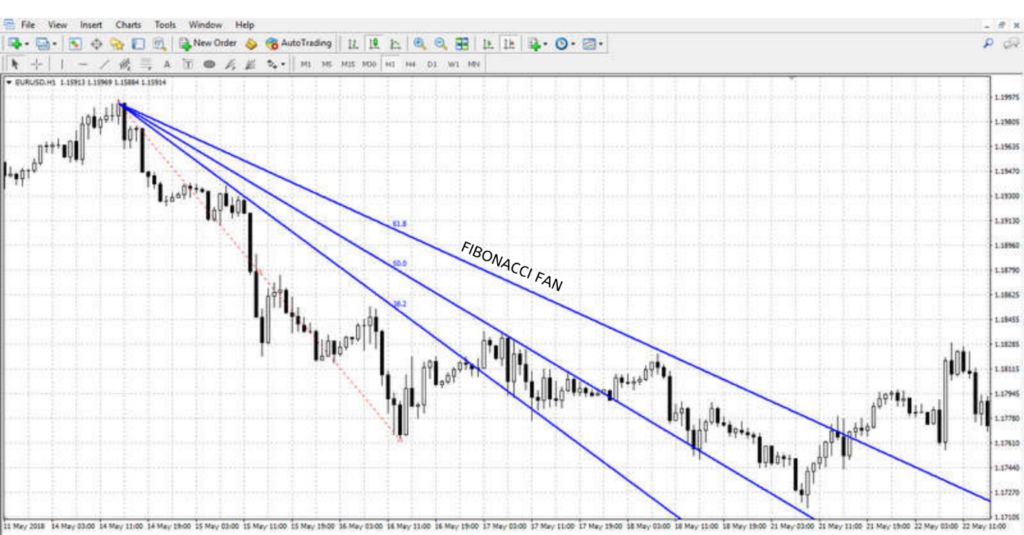
If there happens to be an uptrend, the price chart will be the location of the fan, and if there is the slightest of downtrends, the fan would be located above the price charts, which shows a trend reversal level. Furthermore, the Fibonacci fan can be used with a dynamic stop loss, and you should move the protecting order along one of the fan lines that follows the price movement.
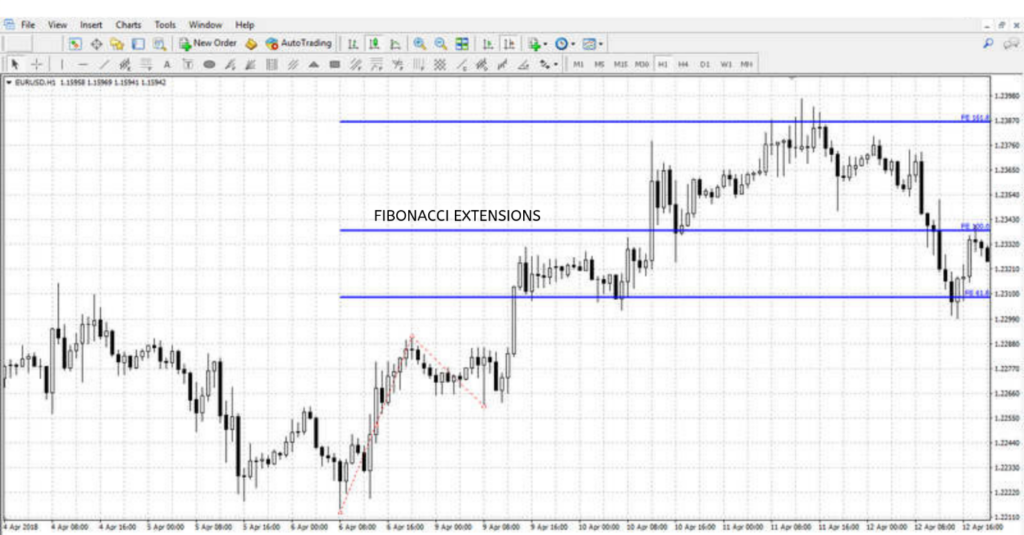
Fibonacci extensions
When talking about Fibonacci extensions, we are talking about a tool used as an auxiliary wave analysis tool. There are three points that create the two waves (retracement and trend waves), which act as the basis for the formation of the indicator. This indicator can be effectively used when set to take profit orders.
Fibonacci arcs, time zones, and fans are for specific tasks and are rarely used by traders. A Fibonacci line, on the other hand, is considered to be the primary tool and is used together with different trading strategies – when confirming existing signals or searching for existing signals.
Adding and adjusting Fibonacci levels to your chart
There are two major ways to add Fibonacci levels on your MetaTrader 4 trading charts:
Select the Insert tab in the main menu of the platform, and then select Fibonacci. This category contains up to five tools in which the Fibonacci channel is located in the Channels category.
You can, therefore, select the tool you require in the Quick Access toolbar at the panel’s top panel. In the beginning, only Fibonacci lines are available on this panel, and you can add other tools by right-clicking on the panel where you would select the Configure option. There, a window will open where you can choose your desired tools to the Quick Access toolbar.
You can adjust each of your indicators after adding it to the chart, and, likewise, you can change the colour, add additional levels, and adjust reference points.
Trading with Fibonacci levels
The Fibonacci lines can be used with other indicators, like a trading strategy or as a standalone indicator. One of the simplest ways to open an order with the Fibonacci levels is to set a pending order after retracement, which is the breakthrough 100 level.
For you to make this happen, you need to stretch the grid of the Fibonacci after the formation of a trend wave from the endpoint extremum of the trend, down to the starting point of the extremum.
Once this is done, the stop order is set below and above level 100. In advance, the take profit can be set somewhat closer to level 161.8. You can set the same stop loss at the same distance from level 100 as a pending order or closer to the level 61.8 whenever stop loss is set at the 61.8 level. The profit or risk ratio is about 1:1.5, and when the ratio is more cautious, we have a ratio of about 1:5.
Trading strategies using Fibonacci levels
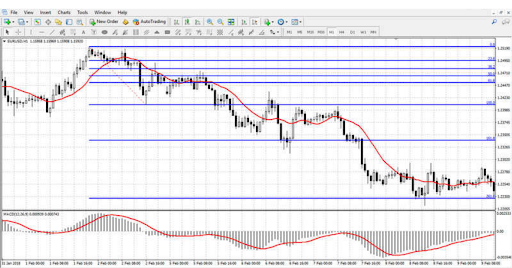
We know that Fibonacci levels are used to set stop losses or confirm entry points, and then take profit. To highlight a trading strategy using the Fibonacci levels, MACD and moving average would be the best example to use.
The first step is to add an oscillator and a trend indicator to your chart – the MA period is 10, and then the MACD is set to default. Here are some of the trading algorithms in this sell order example:
- There is an upward price movement crossing the moving average.
- The histogram of the MACD crosses the same line in the same direction.
- The grid of the Fibonacci is stretched along with the last trend wave. Once the price crosses the moving average at the same time with rebounding or breaking levels in the desired direction, a sell order is opened.
- You can then set a take profit at one of the next Fibonacci levels with your stop set at the previous level.
This is a strategy that can be used for all major forex pairs with the best time frames as H1-D1.
Advantages and disadvantages of the Fibonacci levels
Advantages
- The use of the Fibonacci levels comes with a strength of versatility. This is a tool based on a historical theory that has been used in the analysis of the stock and forex market for many years now. This tool is handy, stretching its use to the cryptocurrency market as well. It has a high versatility such that, even with any market changes, you can make use of it – whether a calm or volatile market.
- This instrument also has a wide range of applications, making it very useful. You can use this tool for finding market exit points and opening new orders.
- Fibonacci levels are an excellent tool for experienced traders, helping them make a profit in the market. However, beginners can also benefit from studying the basics of wave theory. Beginners should also master the basics of trading levels before starting to use numerous Fibonacci indicators.
Disadvantages
The major disadvantage of the Fibonacci indicator is the need for an initial analysis. With the use of other indicators, you can add them to the trading chart and start making use of them. Fibonacci levels, however, should be manually set by traders, and they should also determine reference points by themselves.
Bottom line
We know that when it comes to trading and not just trading, but trading with profit, there is no limit to what a trader can achieve with the right information. As we highlighted in this article, the Fibonacci indicator is one of the most useful tools for trading either as a singular entity or when combined with other tools. The point of the matter is that at the end of the day, the usefulness boils down to proper or improper use. When used accurately, this tool, alongside others, can help you make the right decisions, while, when used as it ought not to be used, it can be a catastrophe – as with other tools. This article has highlighted every major side of the Fibonacci indicator and how you can use it to make a profit, and proper digestion of the facts is a move in the right direction. Take the time to make use of this, alongside any useful material, and you are on your way to profitable trading.
The content in this article is intended and must be used for informational purposes only. It is important that you do your own analysis before making any investment-based decisions on your personal circumstances. You should, therefore, take investment advice from your financial advisor and verify that the content of this article can be relied upon whether for making an investment decision or otherwise.


[…] 35 per cent since March 17. TECHNICALS: $ 6,000 upside resistance for copper, followed by a $ 6,503 Fibonacci retracement level. ZINC: large holdings of LME zinc warrants and historically low LME stocks fuelled […]