
What Is Price Action Indicator?
Candlestick method is the most commonly used price action indicator because it gives information regarding closing and opening price of a market as well as the low and high price levels in a specific time period. A single candle represents an entire day’s worth of trading. It gives details such as:
- The low and high price level signifies the lowest and highest price recorded in a trading day.
- The seller candle body, red or black, means the sellers won the clash of the trading day. This is because the opening price level is higher than the closing price level.
- The buyer candle body, green or white, represents the winning of the buyers in the trading battle. This is because the opening price level is lower than the closing price level.
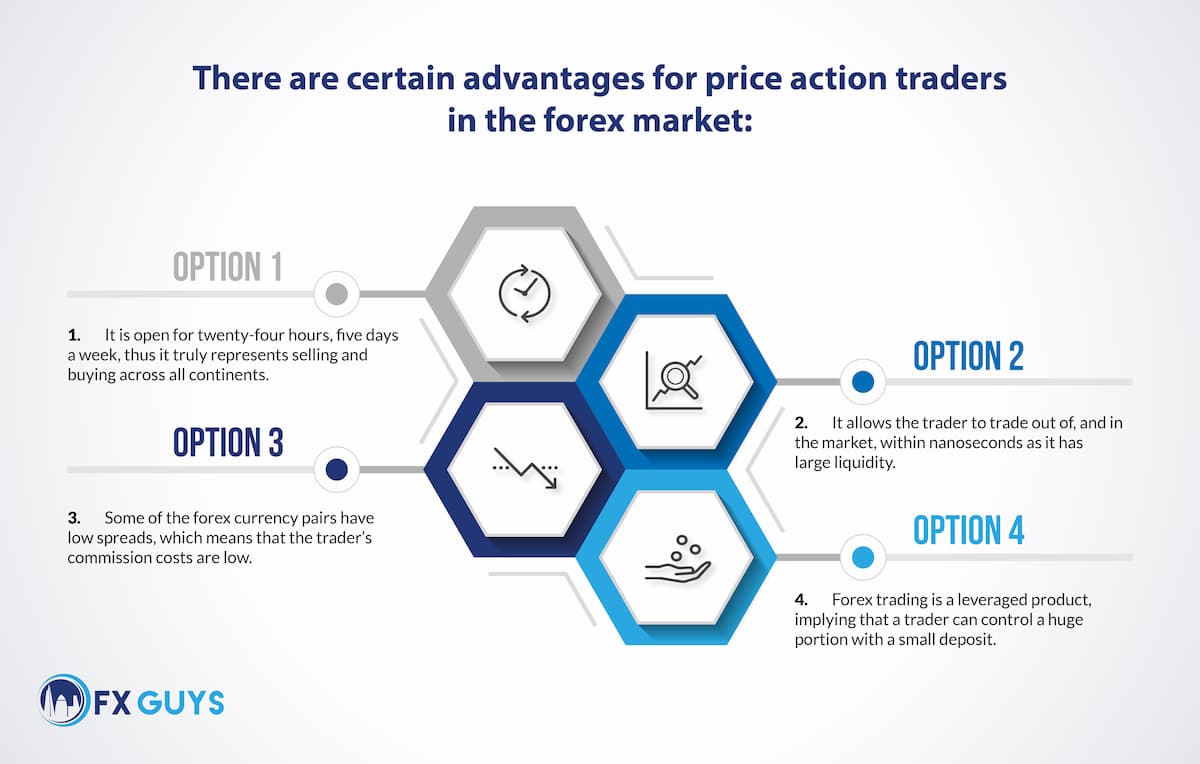
Price Action Trading In Forex
Because price action trading involves the study of sellers and buyers active in the market, it can be applied in any market, such as stock indices, forex, commodities and bonds, and shares and stocks. A trader can view instruments among all of these markets on candlestick charts and, thus, can undertake a price action trading strategy on them.
Price Action Trading Strategies
A trading strategy needs three different elements: the how, the why and the what.
The ‘why’ is the reason traders are considering trading in a specific market. This is where the patterns of price action come into use. Through price action analysis, a trader gains an idea about the next movement of the market.
The ‘how’ is the manner in which a trader will trade. This analysis requires knowing the levels for entry, target and stop-loss. After all, trading is about probabilities, so one must protect themselves and minimise losses if the market moves against their position.
The ‘what’ refers to the outcome of the trade. It depends on how the trader manages in cases of profit as well as undesirable market movements.
Price Action Trading Patterns
- Price Action Reversal Patterns
Reversal patterns are among the most important sets and you need to have a deep understanding of these price action patterns. The patterns mentioned below are multi-swing shape patterns, which means each of the patterns is formed from more than one downswing and upswing taking place in the market.
- The Head And Shoulders Pattern
It is the most popular price action trading pattern in the market. If you want to become a pro at spotting reversals, you must understand and memorise the head and shoulders pattern. This pattern is a reversal pattern that has a swing structure similar to a person’s head and shoulders. The shoulders could be of different heights, or the distance between the head and each of the shoulders might be bigger or smaller. However, you will always find the head in the middle and shoulders on either side in this pattern.
Remember, it is not a head and shoulders pattern if the high of the right shoulder is not above the swing low of the upward movement that forms the head.
The pattern could be both bearish and bullish. The bullish head and shoulders pattern is often called an inverse head and shoulders pattern as it is basically the inverted version of the bearish head and shoulders pattern. Similar to the bearish pattern, if the right shoulder is created above the swing high of the downward movement that formed the head, it should not be read as a bearish head and shoulders pattern. In a bullish pattern, consider buying if the breakout is above the neckline, whereas, in the bearish pattern, you can sell on breakout below the neckline.
- The Double Bottom And Double Top Patterns
These are important reversal price action trading patterns. These patterns are named as such as the market makes two downswings with swing lows at almost equal prices before reversing, in the case of the double bottom pattern; in the case of the double top pattern, two upswings with swing highs are created at similar prices before reversing.
The first part of the pattern is created after the market forms a downswing followed by an upswing. The swing low that casts at the bottom of the swing is among the two bottoms that appear during the pattern. The next swing low and bottom always end up creating a similar point to where the first swing low was cast, and the complete swing structure will usually resemble the letter ‘W’. This structure represents a double bottom pattern. You can think of buying if the breakout is above the resistance line.
The double top pattern is the opposite of the double bottom pattern. A double top pattern’s formation consists of two upswings that take place with swing highs appearing at similar prices to each other instead of two swing lows. You should consider selling if the breakout is below the support line.
Both patterns become invalid if the second bottom or top in both of the patterns forms at a price that is distant from the price at which the first bottom or top has formed. There is no exact guideline regarding the distance, but if there are more than two large candlesticks close above the first top or below the first bottom, then it might not be a double top or double bottom pattern.
- The Rising And Falling Wedge Pattern
The falling and rising wedges get their names from the manner in which the market sometimes contracts before the culmination of a down-move or up-move.
Usually, at the start of the wedge, the distance between the market hitting the lower wedge line and the upper wedge line is quite significant. As the pattern progresses, this distance keeps on decreasing until it appears as if the lines would meet.
The falling wedge always signifies that the market might reverse to upside, and is a bullish wedge pattern, whereas the rising wedge pattern signifies that the prices may fall, and is a bearish wedge pattern.
- Price Action Continuation Patterns
These price action trading patterns are a signal to the traders that the current trend is more likely to continue, unlike reversal patterns, so price action continuation patterns are the opposite of the above-mentioned reversal patterns.
- The Rising And Falling Wedge Continuation
Rising and falling wedges can be continuation patterns in case they form during upward or downward trends. The reversal formation of a falling wedge will always cast at the end of down-moves, but the continuation variation will appear only during up-moves.
The wedge forms in a similar way to how it forms when it is indicating a reversal at the end of a downward trend. The swing squeezes as the pattern continues to form until an upside breakout occurs, thrusting the market above the swing highs that had formed because of the market hitting the steeper downside slope of the pattern.
The rising or bearish wedge is only considered as a continuation pattern if it is formed during downtrends. In case you see it forming during an uptrend, it is a reversal pattern and not a continuation pattern. You should sell when the price falls below the support.
A bullish or falling wedge pattern takes place in an uptrend and the lines slope down. You must buy when the price crashes above the support.
- The Bullish And Bearish Flag Pattern
Often called a bull flag or bear flag, these price action trading patterns are popular price action continuation patterns. They are so named because they resemble the structure of a flag mounted on a pole. You must buy on a breakout over a bullish flag pattern, and you must sell on breakout under a bearish flag pattern.
A bullish flag pattern consists of a sharp bullish move (pole) followed by a retracement (flag). The retracement should always end before it reaches the 50% Fibonacci retracement level of the downswing, creating a flag.
The bearish flag is an upside-down variant of the bullish flag. Both of these patterns form in an exact way as well as abiding by the same rules. These patterns are often a trustworthy signal that the current movement will continue.
- The Ascending And Descending Triangle Patterns
These price action trading patterns are similar to falling and rising wedge patterns. The only difference is that the triangle patterns are always made with one straight edge, which acts as a support level or resistance until the market breaks out of the pattern and goes on to progress in the direction of the prior trend. The ascending triangle is a bullish variant, whereas the descending triangle is the bearish of the two.
The ascending and descending triangles differ as in the ascending triangle pattern. The straight edge is a support level that stops the market from moving lower, whereas a descending triangle pattern’s straight edge is a resistance level that stops prices from increasing.
You can buy breakout beyond an ascending triangle. Also, you should sell on breakout under a descending triangle.
- Price Action Candlestick Patterns
There are multiple candlestick patterns; however, these two are the most important:
- Pin Bar/Hammer Candlestick
This is a single candle pattern that can be seen forming across all currencies as well as all time-frames in the market. It is one of the price action reversal patterns, as it signifies that a reversal is going to take place, so if you are a price action trader, you must watch out for it.
The bullish pin bar signals that a reversal to the upside might take place. The body of a bullish pin bar can be located on the top of the candle and its wick is found beneath the top. A bearish pin bar will have its body at the bottom with its wick extending upwards in a candlestick. It can be present anywhere in the bottom half of the candlestick.
- Engulfing Candlesticks
Engulfing candles is also a reversal pattern, which implies that a reversal might take place immediately after you spot it in the market. It is a two-bar reversal pattern, so it requires two candlesticks for its complete formation.
The bearish engulfing pattern will always signify that a reversal to the downside might take place. The pattern has a green or white candlestick followed by a large red or black candlestick that engulfs the smaller candle. It indicates that it is time to sell.
In the bullish engulfing candle, the second candle entirely engulfs the body of the first. It appears in a downtrend and is a combination of one black or red candle followed by a larger white or green candle. It indicates that it is a good time to buy.
Key Takeaway
The above-mentioned price action trading patterns only indicate the current situation, which changes for a number of reasons; therefore, although these price action trading patterns signify whether it is time to buy or sell securities, you must consider the trend history before making important decisions.