
Commitment of Trader’s data is an accumulation of all futures data by market participants from the CFTC in the US.
Honestly, we think it can be a very powerful tool, not so much for intra-day traders but for longer term traders in the search for their edge. In this article, we’re going to show you the basics on how to interpret this data.
The following chart shows the commercial speculators in red (merchants, producers), the non commercials in green (large players such as banks and hedgefunds) and small trader positioning in blue on USD futures.
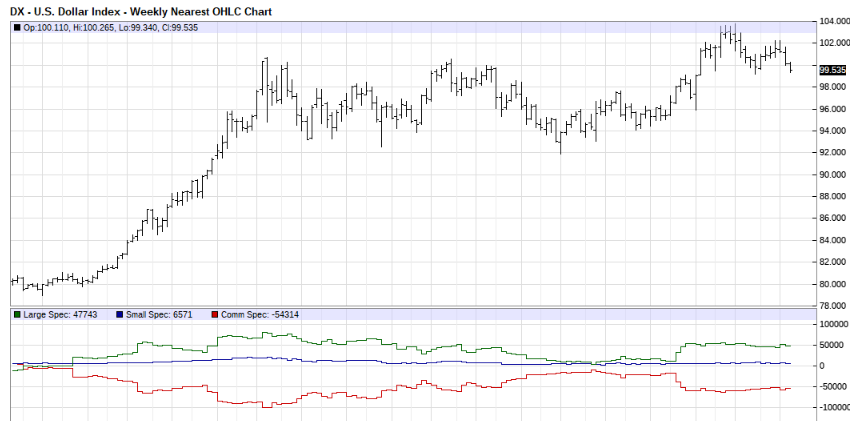
Note that the non commercials and commercials are a mirror of one another. This is because as one is buying (non commercials) the commercials maintain a hedging position in the market.
This data is useless, however, without price and former positioning context. We can see the price of the USD above reaching a peak of 104. To put this into context, the rally out of the capped region was caused by Trump’s coming to power. Note the increase in non-commercial net longs and commercial net shorts. Price could be indicating a topping pattern here. At the same time, we are seeing a relatively extreme net position of roughly 50,000 contracts (remember non-commercials and commercials net to 0 but either side there are 50,000 contracts being mirrored). This is one big indication of a market turning point and potential downside in the USD.
Let’s look at another example.
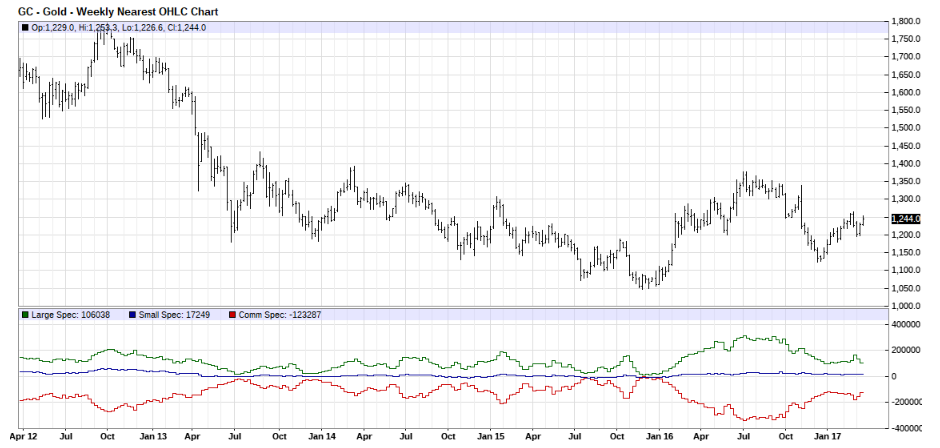
Note July and August of last year. We saw a massive expansion in interest in the market where non-commercials increased their net longs to 297,463 contracts. This was a 20 year high! Price then fell for the next 6 months.
This is the 20 year chart.
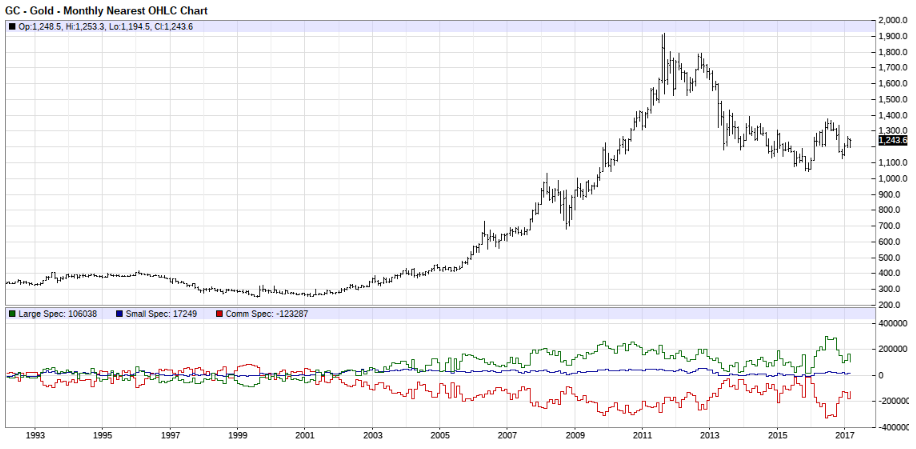
Again, we have to contextualise the asset. Gold most probably gained this increase in longs as a hedge against 1. Inflation, since inflation expectations had picked up for the first time since 2008 and 2. The geopolitical risks faced from Brexit and Trump’s (at the time) potential presidency. However, we are seeing a cooling off in price from 2013-current due to increases in hike expectations.
What we should take from the understanding of the above is that we can use COT to provide sentiment at market tops and bottoms and to understand the flow of money to and from assets. It can identify which assets are deemed desirable at times when it may be difficult to discern, such as with geopolitical risk. However the main benefit is for identifying sentiment changes at market tops and bottoms… not that we advise trying to catch any. Use this in combination with (obviously not solely) your strategy and it really can bolster your edge.