FX Guys

How To Trade Using The Stochastic Oscillator

A Step-by-step Guide on How to Use the Stochastic Oscillator Indicator to Trade

Many traders today do not understand the use of indicators and many who know about indicators, still use them in the wrong way. In this article, we will discuss the stochastic oscillator, understand its principles, what it does, and how it can be used to trade.

The stochastic indicator is a momentum indicator that was developed by George C. Lane in the 1950s as an indicator that shows the position of the most recent closing prices with regard to the previous low-high range.

Definition of the Stochastic Indicator

A stochastic indicator is a trading tool that provides information about trend strength and momentum. This indicator analyses price movements and helps us understand how strongly and quickly prices move.

Looking at the definition of the stochastic indicator, we mention something important, something we would need to remember as we go on: momentum. 

What is Momentum?

Momentum is the acceleration rate of a security volume or price – the speed at which prices are changing. In simple terms, it is the rate of change on a price movement for a specific asset and is typically defined as a rate. In technical terms, momentum is known as an oscillator that is used to identify trend lines.

We have a lot of information on the basics now, so let’s dive into the more technical aspects of the stochastic oscillator.

The main idea behind the stochastic indicator is simple:

It works on the basis that changes in momentum come before changes in trends and price action. Take the momentum being discussed to be a car moving at a certain speed. When it wants to make a turn (change in trend) it must slow down (change in momentum). This change in momentum helps to locate possible reversal points in the market.

Stochastic Oscillator Parameters

The two main parameters (lines) of the stochastic indicator are:

  • %K The main line
  • %D The second line

The formula used for calculating is:

%k = 100(C – L𝑥) / (H𝑥 – L𝑥)

  • %D is a three day simple moving average (SMA) of %K.
  • L𝑥 is the low of the previous 𝑥 trading sessions.
  • C is the last closing price.
  • H𝑥 is the high of the previous 𝑥 trading sessions.

Trading Strategies Using the Stochastic Oscillator

Here are a few tips to adding the stochastic into your trading strategy:


  • Finding a divergence between the price and the stochastic oscillator


The divergence between price and indicators in the market can signal a forthcoming trend reversal later. This also applies to the stochastic. 

Bearish Divergence Between Price and Stochastic Oscillator on the BTC/USD 1 Hour Chart

In the preceding chart, we see prices making a higher high from point 1 to point 2; however, the stochastic oscillator indicates a lower high, which is a loss of momentum as Bitcoin makes a new high. These divergences can last a long time; the best thing to do is to wait for the stochastic to drop below 80 before going into a short position. At point 3, there is a rapid drop on the stochastic oscillator, which coincides with a double top at USD 4,200 and presents a better trade opportunity.

However,on the main chart, a bullish divergence occurs when a price makes a lower low, while the stochastic indicator shows a higher low.

A Decline in BTC To the USD3,200 Range Showing 2 Bullish Divergences

There are two bullish divergences in the preceding screenshot. The divergence 1 fails to pop above 20 on the stochastic oscillator. Just like entering a short position before the stochastic drops below 80, entering a long position before the stochastic oscillator rebounds above 20 is usually risky. In this situation, the price ended up moving downwards to point 2.

The stochastic rebounds above 20 in the second bullish divergence (green), which indicates the presence of bullish momentum and a possible trend reversal ahead.

Trading the Stochastic Crossovers

Scholastic crossovers between %D and %K lead to excellent signals most of the time, especially when used with other indicators.

Four Examples of Stochastic Crossovers on the BTC/USD 4 Hour Chart

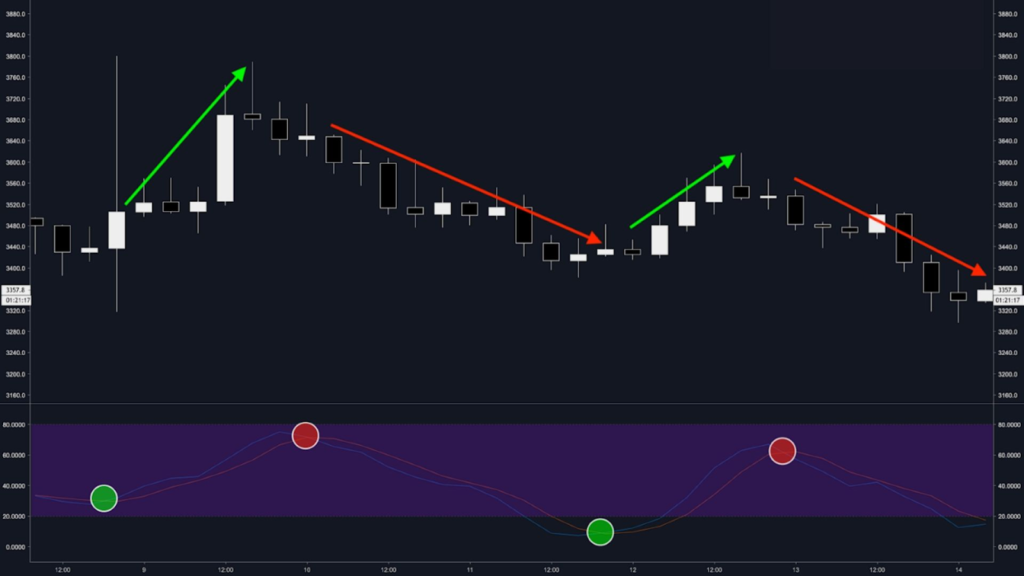
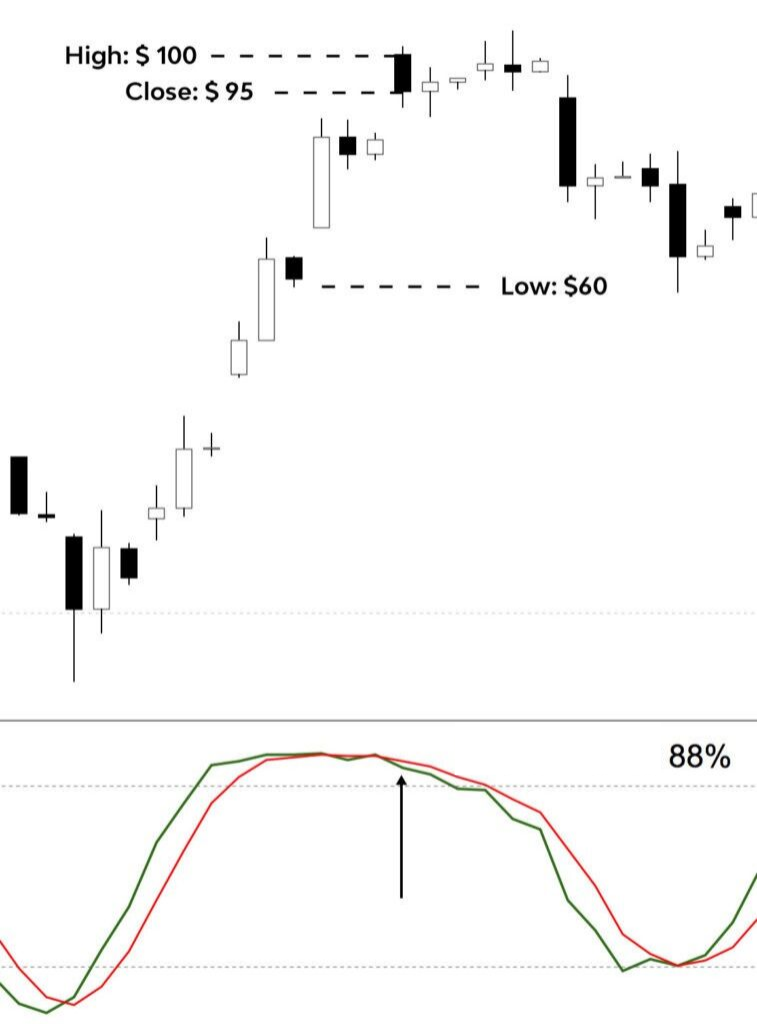
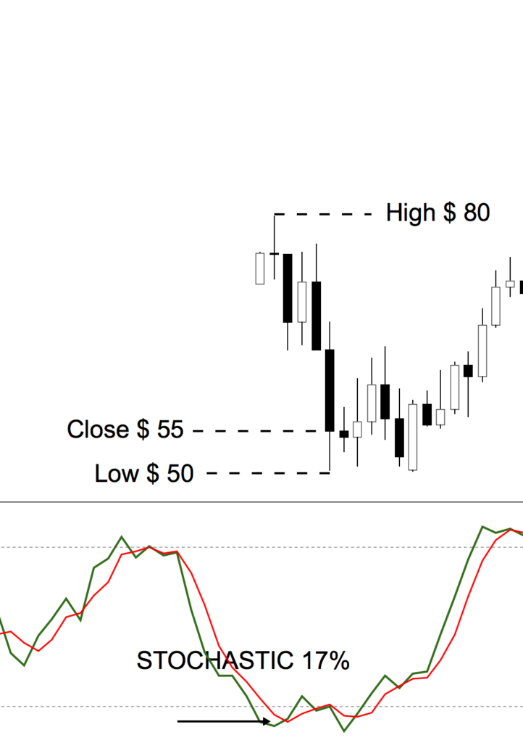
Generally speaking, %D crossing over %K is bearish while %K crossing over %D is bullish. The price action in the preceding screenshot, following the bearish crossover, is negative, while the price action following the bullish crossover is positive.

Using Multiple Scholastic Indicators

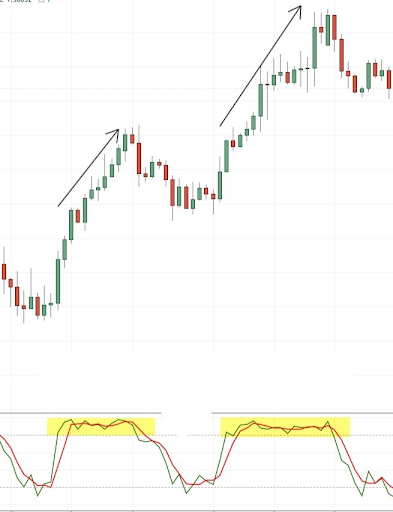
Trading with multiple scholastic oscillators to gain insight into volume momentum at different times is a trading secret most traders use. For example, the 21,14,14 multiple stochastic oscillator uses data from the previous 21 days trading periods for a macro-level viewpoint of the market, while the 5,3,3 stochastic analysis can be used for close range references. You can try setting up 21,14,14, 14,3,3, or 5,3,3 if you want to understand further how the scholastic oscillator reacts to different trading periods.

Combining the Stochastic Indicator Analysis with Other Tools

The stochastic oscillator is a very efficient trading tool. However, like other trading tools, the probability of getting better results when combined with others is very high. To improve the quality of your trades, you can combine the stochastic with these three tools:

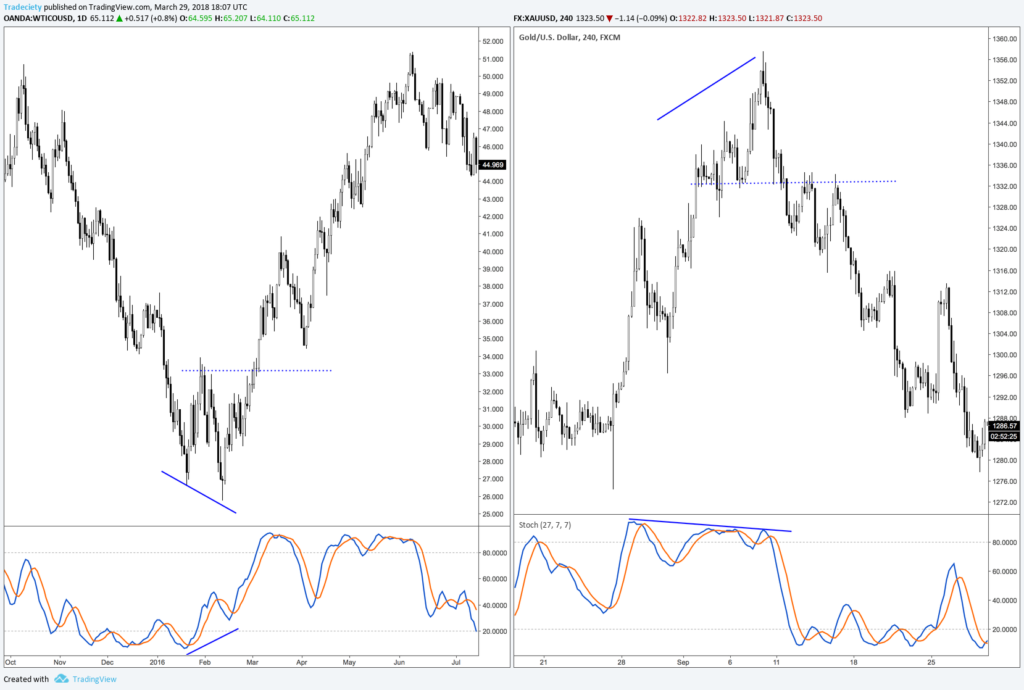
Trendlines: trendlines can be used to trade stochastic reversals or divergences. Here, you need to find established trends with a valid trendline and then wait for the price to break it when you confirm your stochastic.

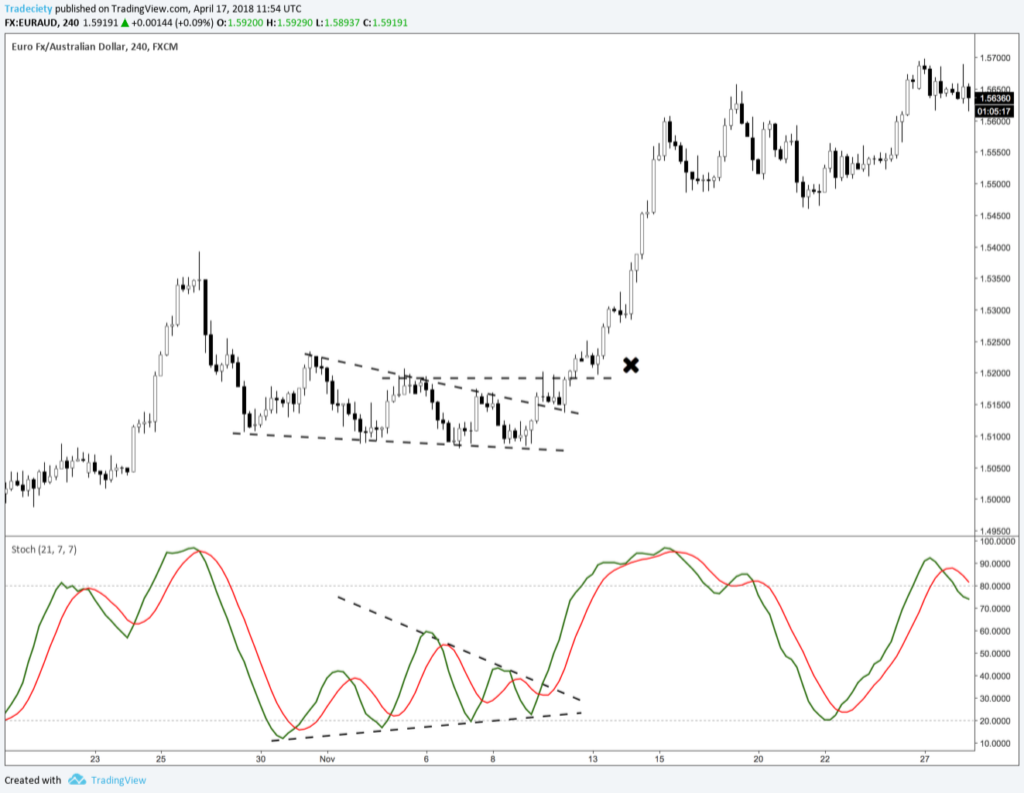
Price formations: in breakout and reversal trades, you should look out for the formation of rectangles, triangles, and wedges. When a price breaks any of these formations with an accelerating scholastic, it is a possible signal for a successful breakout.

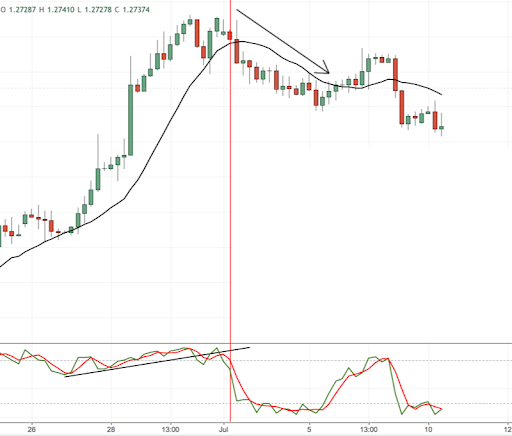
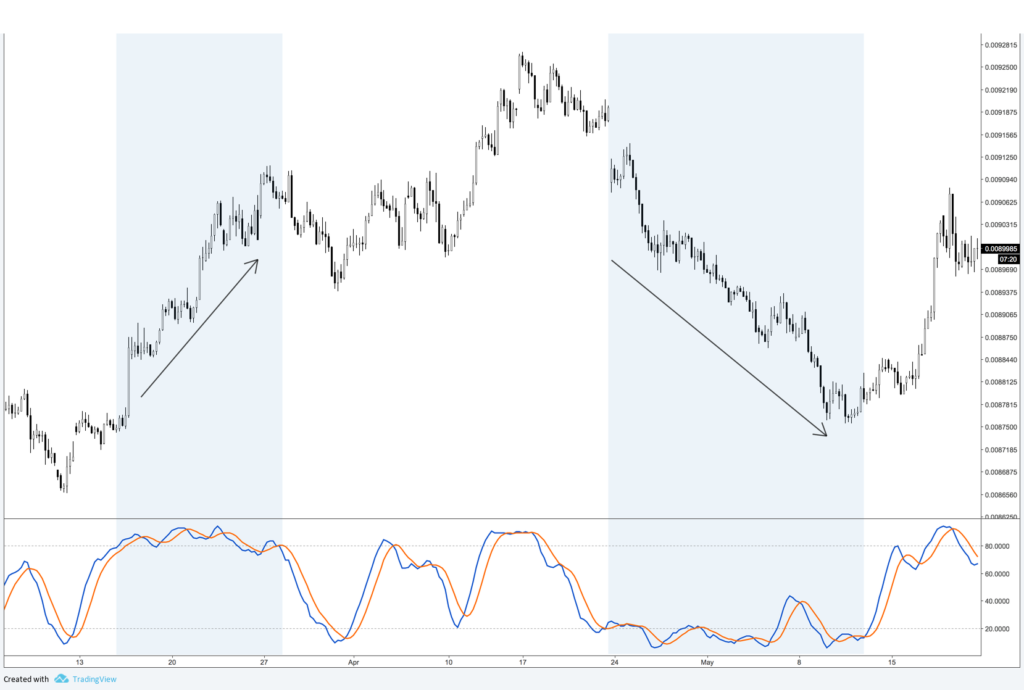
Moving averages: a moving average is an excellent addition to the stochastic that acts as a filter for your signals. With this, you trade in the direction of your moving averages, and as long as your price is more than the moving averages, you only look for longs and shorts.

The First Time the Red Scholastic Crosses Below Overbought. Shortly After the Breaks the Moving Average.
The Stochastic Signals

In this section, we will look at the most common stochastic signals and the ways that traders use them to make profitable trades:

  1. Strong trends: when the scholastic indicator is in the overbought or oversold area, you simply have to hold on to your trades and stick with your trend, instead of fighting it. 
Chart Showing Overbought and Oversold, and how they can be used as trend signals.
  1. Trend Following: here, we talk about following a trend that is still valid. A trend is said to be valid if the stochastic stays crossed in one direction.
  2. Breakout Trading: when a scholastic accelerates suddenly in one direction, with the two scholastic bands spreading, this is a prospective signal for a new trend. It is even better if you can spot a breakout of the sideways range.
Spotting a Breakout out of a Sideways Range

Divergences: divergences help you spot potential trend reversals or even the end of a trend.

Divergence signals showing potential trend reversals
Oversold vs Overbought

We know how much stochastic indicators are linked with overbuying and overselling. The scholastic oscillator, however, shows momentum and not overbought or oversold. Traders generally say that when a stochastic is over 80, it means the price is overbought and a when a stochastic is below 20, the price is oversold. With this idea, traders lean on the idea that an oversold market has a high tendency of going down and an overbought market has a high chance of going up. This is incorrect and is a very dangerous way to trade.

In a bid to throw more light on this, we look to examine the behaviour of a scholastic indicator within a long downtrend and uptrend. Here the scholastic oscillator enters an overbought and oversold position (above 80 and below 20) and stays there for a while with a steady trend. You can see that a belief that the stochastic shows overbought or oversold is wrong, and you would run into problems. The high scholastic value here shows that the trend has a strong momentum.

Scholastic Values Showing Momentum
Examples on the Use of the Scholastic Indicator

Here, we are going to highlight simple examples that show how an indicator analyses prices without making it look complicated. We use the stochastic indicator to analyse price ranges over a specific period of time or price candles. This means that the stochastic indicator takes the absolute high and low of that period and compares it to the closing price. We have come up with two examples with five period stochastics, which means that the stochastic only makes use of five candlesticks for analysis.

First Example: A High Stochastic Number

A high scholastic value means that the price has closed near the top of the range over a number of price candles or within a certain period of time.

Graph Showing a High Stochastic Value of 88%

This graph shows a low price of $60 and a high price of $100. This, therefore, has a range of $40 and a closing price of $95 at the top. The stochastic shows a percentage rate of 88%, which means the price only closed about 12% from the top.


Calculating a High Stochastic

  • The five candles have their highest high at $100
  • The five candles have their lowest low at $60
  • The close of the last candle was at $95

With the formula provided earlier in this article, we have a value of the stochastic indicator at: [(95 – 60) / (100 – 60)] x 100 = 88%

You can see that we have an indication of a strong price over the five-candle period, which also highlights that the current candles are pushing higher.

Second Example: A Low Stochastic Number
Graph Showing a Low Stochastic Value of 17%

Calculating a Low Stochastic

  • The five candles have the highest high of $80
  • The five candles have the lowest low of $50
  • The close of the last candle was at $55

The value of the stochastic indicator: [(55 – 50) / (80 – 50)] x 100 = 17%

The stochastic value of 17% means that the price closes only 17% above the low of the range, which means that the downside momentum is strong.

Conclusion

In summary, the stochastic oscillator is an indicator that shows momentum. It is also a valuable tool for finding weaknesses and strengths in price action over a specific period of time. To successfully use the stochastic oscillator, you have to understand the asset and find the correct settings for that asset. Used with other indicators, such as candlestick patterns, and RSI, the stochastic oscillator can help you develop a working and profitable trading strategy.

If you are able to read the momentum of your charts by looking at the candles, you might not need the stochastic oscillator. However, if this tool is your tool of choice, it would really go a long way in helping you make profitable trading decisions.

This article is meant to enlighten you about most of the tools you use for trading. The internet today is saturated with a lot of information, which includes a lot of bad information to say the least. With each piece of information that comes your way, you need to take responsibility and do your homework. 

The information provided here is not financial advice, and should not be seen as a recommendation for any investment decision. With whatever information comes your way comes the responsibility of personal research. 

 To everyone in the world of trading, remember, whatever we make out of what we have is not a factor of luck but a factor of preparation, research, and consistency. Nobody progresses by merely waiting for things to happen for them: they make things happen. Take time out to process what has been provided here and make the best out of it.