Candlesticks and Pinbars tell you a massive amount about order flow, sentiment and what market participants feel about current and past prices. We’re going to highlight a few candlestick patterns that we watch out for but also put them into context, since candlesticks alone can not tell you about a market.

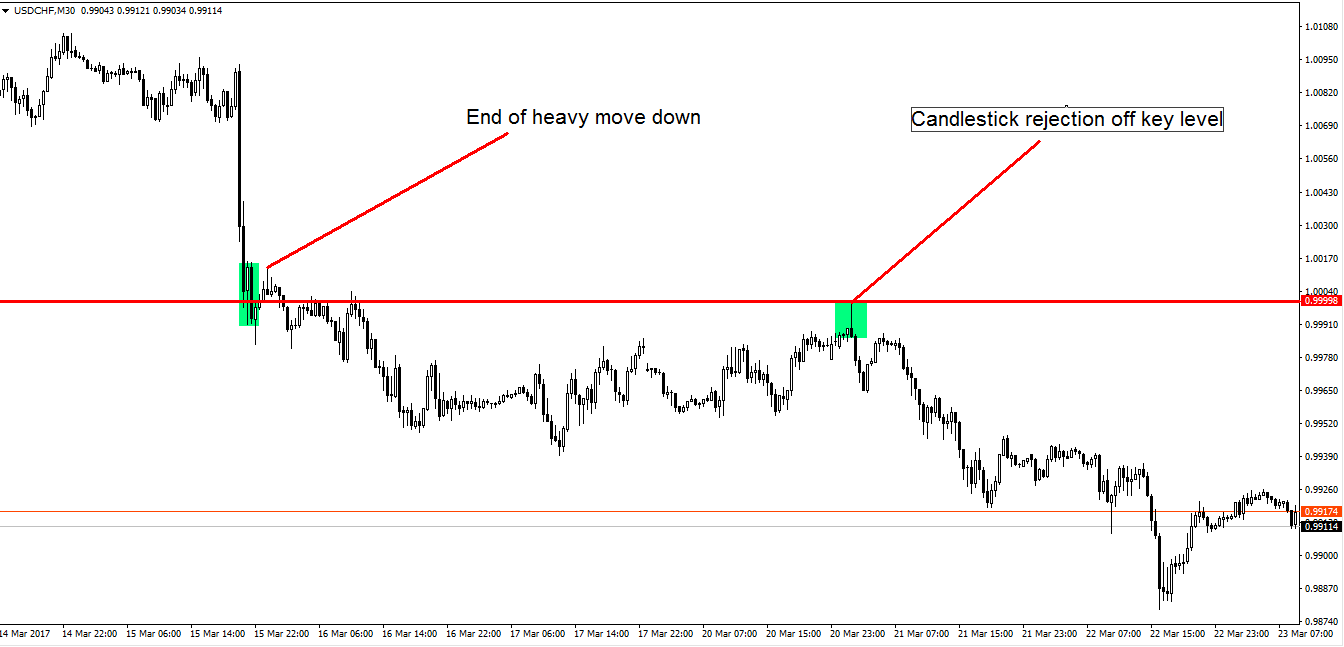
This is an M30 chart of USDCHF. We can see that there was a heavy price breakdown on the 15th of March down to CHF 1.000. Price continued down to sub-0.9950 and then made a test at 1.000 again. What is key here is that there was a massive upside rejection of the 1.000 level. I’m not a great believer of psychological levels since I’ve seen them broken so much, but I am a believer of pin bars and their relevance in identifying direction rejections.
A pinbar, if you don’t know is this:

This shows that buyers tried to push the market up, but were overcome by sellers and forced the market down. A black candle identifies that the market closed below its candle open price. Combining this with the significance of the level that was rejected, and this would be a bearish signal to me.
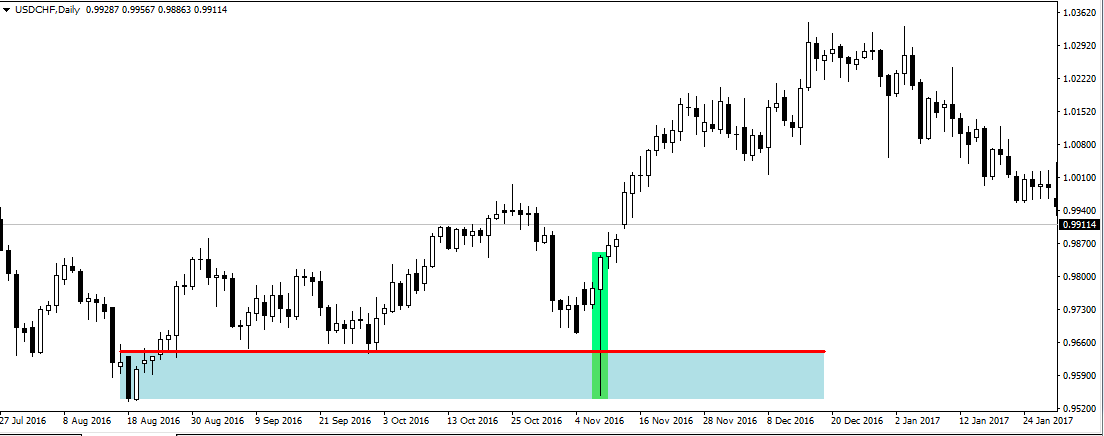
Again looking at a pinbar, but this time with different context.

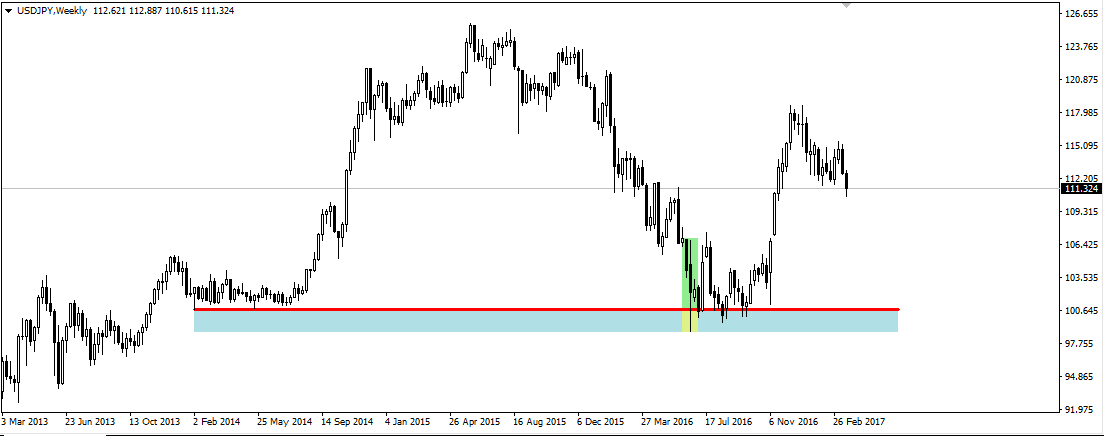
The red line shows the low of a range for about 2 months from late August to early November. The green candle was Trump’s election victory. What occurs frequently with major events is an initial clear out of stops in one direction which allows for a new trend to form. Here is another example with USDJPY:

Here we had to wait a while for lift off, but the mechanics of taking the range stops from the previous time demand entered the market and accumulating until the rally still ‘worked’.
Remember that the market context always matters, and higher timeframe rejections matter even more.


