
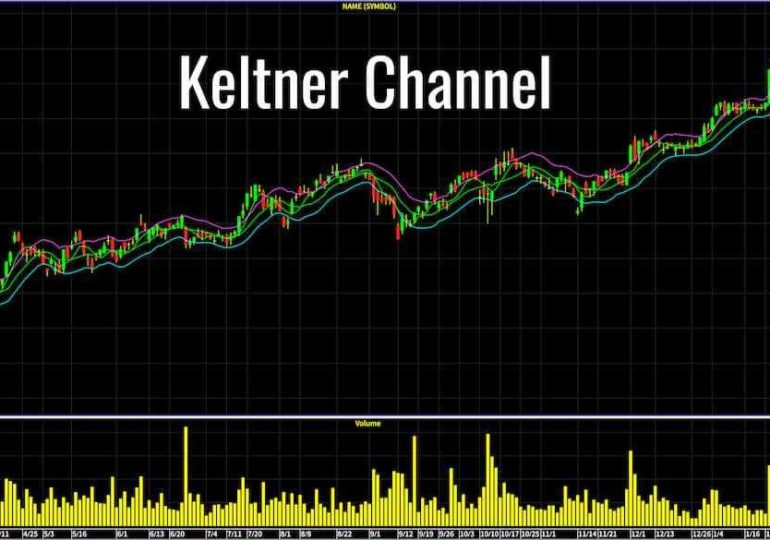
What is Keltner channel?
This trading tool is a volatility-based indicator which makes use of three separate lines. The central line is an exponential moving average (EMA) of the price of your trade, whereas the extra lines are placed above and below the EMA. The upper line or band is located above the EMA and is set as twice the Average True Range (ATR), while the lower line or band is located below the EMA and is set as twice the Average True Range (ATR). These lines move in accordance with volatility, expanding, and contracting as volatility does as well.
Since most of the price actions are located within the lower and upper bands, any moves outside the bands can signal trend acceleration and other trend changes. The channel directions can also help in identifying the asset trend direction.
Things you have to remember when you are trading with this tool:
The Keltner channel EMA is usually 20 periods, even though this is something you can adjust if you want.
The price getting to the lower band is bearish while the price reaching the upper band is bullish. Touching a band might indicate a trend continuing on that path.
The channel angle also helps you to identify the direction of the trend. When you have the direction of the channel facing upwards, the price is growing. If you have a channel moving sideways, then the price is moving in that direction as well.
Price may oscillate between the lower and upper bands. When this happens, the lower band is viewed as support and the upper band as resistance.
The lower and upper bands are set to twice the ATR below and above the EMA, even though the multiplier can also be modified based on preference.
The Formula is:
\begin{aligned} &\text{Keltner Channel Middle Line} = EMA\\
&\text{Keltner Channel Upper Band} = EMA + 2*ATR\\
&\text{Keltner Channel Lower Band} = EMA – 2*ATR\\
&\textbf{where:}\\ &EMA = \text{Exponential moving average
(typically over 20 periods)}\\ &ATR = \text{Average True Range
(typically over 10 or 20 periods)} \end{aligned}
Keltner Channel Middle Line=EMAKeltner Channel Upper Band=EMA+2∗ATRKeltner Channel Lower Band=EMA−2∗ATRwhere:EMA=Exponential moving average (typically over 20 periods) ATR=Average True Range (typically over 10 to 20 periods)
Calculating Keltner Channels
- Based on the number of periods you picked, calculate the asset EMA
- Based on the number of periods you picked, calculate the asset ATR
- Use two or your desired multiplier to multiply the ATR and then add the answer to your EMA value to get the value of the upper band.
- Use two or your desired multiplier to multiply the ATR and then add the answer to your EMA value to get the value of your lower band.
- Replicate these steps for every period.
What information do you get from your Keltner channel? H4
The Keltner channel, which was first introduced in the 1960s by Chester Keltner, previously calculated using the simple moving averages (SMA) as well as the high-low price range – initial formula. A new formula appeared in the 1980s that made use of the ATR, which is generally used nowadays.
There are many ways in which this tool can be used, but this is basically reliant on the trader’s employed settings. If you have an extended EMA, this will result in more lag in the indicator, which would also mean that the channels would not respond quickly enough to price changes. When you have a short EMA, however, it signifies that bands would react too rapidly to changes in price, which makes it more challenging to identify the real direction of the trend.
A more significant ATR multiplier to generate the bands would mean a more prominent channel, which would make the price hit the bands less often. When you have a smaller or shorter multiplier, on the other hand, you find the bands getting closer with the price reaching or exceeding the bands more often.
As a user, you can set up this tool whichever way you like with the following possible uses in mind.
The channel angle helps with the identification of the direction of the trend. When a channel is falling, it signifies a drop in price, while when the channel rises, it means that the price has been rising as well.
When a price moves above the upper band, it signifies price strength. This shows that there is an uptrend, particularly if the channel is moving upwards.
Whenever there is a drop lower than the lower band, there is a weakness in price, which shows that there is a downtrend mostly with a channel in a downward direction.
If you have a price frequently touching the upper band and not the lower one and then the price eventually hits the lower band, it signifies the loss of momentum for an uptrend.
However, if you find a price frequently touching the lower band without touching the upper band, whenever the price finally touches the upper band, it could signify that the downtrend is almost at an end.
There might also be an oscillation of prices between the lower and upper bands. In these types of cases, bands can be used by traders as resistance and support. Traders might want to buy whenever the price gets to the lower band and then begins to move higher once more. Traders might look to short or sell after the price starts falling again after getting to the upper band.
At the conclusion of a period going sideways, once price breaks below or above the channel and the channel begins to angle in the same direction, it might signify that a new trend is ongoing in the breakout direction.
Difference between Keltner channel and the Bollinger Bands
The Keltner channel and the Bollinger Bands are very alike even though the Keltner channel makes use of ATR while the Bollinger Bands make use of standard deviation to calculate the bands support and resistance. These indicators have similar interpretations and, since calculations are different, the results and trade signals derived from these indicators might be different as well.
Limitations
We know that this trading tool only as useful as the settings selected, so traders first have to select the way they want to make use of the indicator and then set it up to help them complete their mission. Some of the uses of the Keltner channel highlighted above would not function properly if the bands are far apart or too narrow.
These bands might not function as support and resistance as they might seem to have small forecasting abilities. This can be caused by the selected settings, but there is no proof that the price moving both ATRs or hitting a single band would lead to a trading opportunity.
Although the channel can help with the identification of the direction of trends and provide trade signals, they function better when used with price action analysis fundamentals for long-term trading as well as with other indicators.
Bottom Line
This trading tool is a priceless tool for traders and is somewhat efficient when it comes to having an understanding of proper use. Many do not understand the concept of slightly adjusting the settings for trading different assets, making use of a uniform setting, and bearing losses they should not. The settings used on a certain asset might not work for the other, which means improper use. Before trading with real money using this trading tool, the best thing you can do as a trader is to practice using the indicator on a demo account. This way you can practice trading on different assets and gain an understanding of which trades to take and the ones to avoid.
You can say that you have mastered the art of using this tool only when you have practiced and won successfully. It is at this junction that you can begin trading with real money. So, take out time to make this a priority because the best way to earn as a trader is to learn.
If you are in too much of a hurry to make money, then you are sure to lose both your interest and capital in the process, leading to a loss that may take you out of the game of trading. This advice has helped many traders move from accruing high losses to making a profit. Start practicing the use of the Keltner channel today, and I can assure you that it will be worth every minute of your time.
This article is not meant to be taken as investment, tax, or financial advice. This article is designed for educational purposes and is presented without consideration of the investment risk tolerance, or your personal financial circumstances as an investor and might make this the wrong choice for you. The results from the past do not dictate the outcome of the future, and the understanding that investing involves risks and a potential loss of money, including initial capital, should always be at the back of your mind.