The Principles and Distinctiveness of MACD
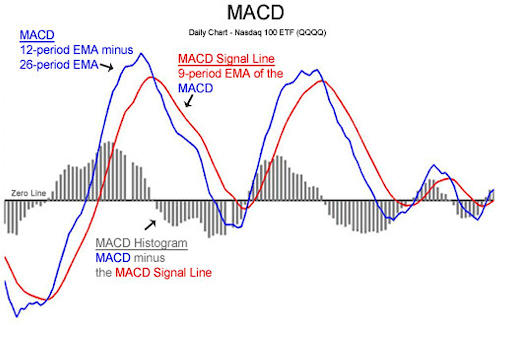
The MACD is an oscillator also known by many as trend oscillators or trend indicators. It is an oscillator based on two moving average indicators applied to the chart; the MACD is displayed separately on another window underneath the chart as a histogram. The histogram shows the divergence of two moving averages; if one of them moves away from the other, the bar on the histogram becomes longer and if the moving averages get closer, the bar gets shorter.
Thus, fast movements will result in long bars in the Moving Average Convergence/Divergence histogram while a flat movement would be indicated by short bars.
The Moving Average Convergence/Divergence Indicator
If the histogram is above the zero line, then we have a fast-moving average rising above the slow-moving average, progressively moving away from it, indicating an uptrend. If the histogram bar is below the zero line, we have a slow-moving average rising above the fast-moving average, indicating a downtrend.
There is an auxiliary line that intersects with the histogram most of the time in the indicator window. This auxiliary line acts as the moving average calculated from the histogram readings. This line helps receive extra signals from the indicator to help improve the quality of trade decisions.
The Moving Average Convergence/Divergence is a resourceful tool that can be interpreted in three ways:
- MACD histogram
- MACD divergences
- Moving Average Crossovers
The information provided here is for educational purposes and is not trading advice. It is not a solicitation to sell or buy any commodity or Forex product. Past performance in any trend is not an indicator of a future trend; trading is all about taking informed risks. We shall not be liable for results – whether positive or negative – which come from the use of, or inability to use, the information provided in this article.
- The MACD Moving Average Crossover
The moving average crossover is the primary method of reading the Moving Average Convergence/Divergence. When the shorter-term 12-period EMA (exponential moving average) crosses over the longer-term 26-period EMA, a buy signal is created; this can be seen on the Nasdaq 100 exchange chart with the purple lines.
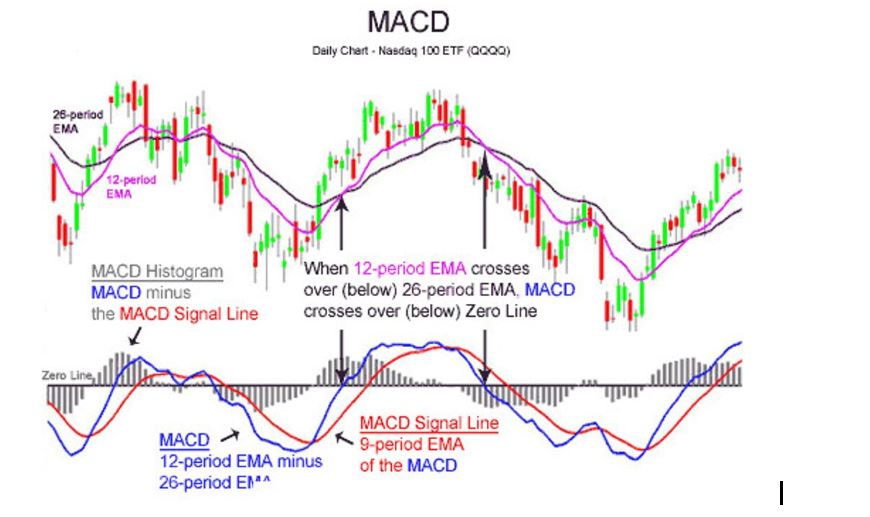
The Moving Average Convergence/Divergence Line is the blue line; this is created from the 12-period and 26-period EMAs. From this chart:
- When the 12-period EMA goes below the 26-period EMA, the MACD line crosses below the zero line.
- Also, whenever the shorter term 12-period EMA crosses above the longer term 26-period EMA, the MACD line is above the zero line.
Note
- A probable buy signal is generated when the Moving Average Convergence/Divergence (the blue line) moves above the zero line.
- A probable sell signal is generated when the MACD moves below the zero line.
The MACD moving average crossover is one of the best ways to interpret the Moving Average Convergence/Divergence technical indicator.
The information provided here is for educational purposes and not trading advice. It is not a solicitation to sell or buy any commodity or Forex product. Past performance in any trend is not an indicator of a future trend; trading is all about taking informed risks. We shall not be liable for results – whether positive or negative – which come from the use of, or inability to use, the information provided in this article.
- The MACD Histogram
The MACD histogram is the difference between the MACD Line and the Moving Average Convergence/Divergence signal line. The following histogram highlights what we are talking about here as we look at the MACD histogram in the Nasdaq 100 QQQQs
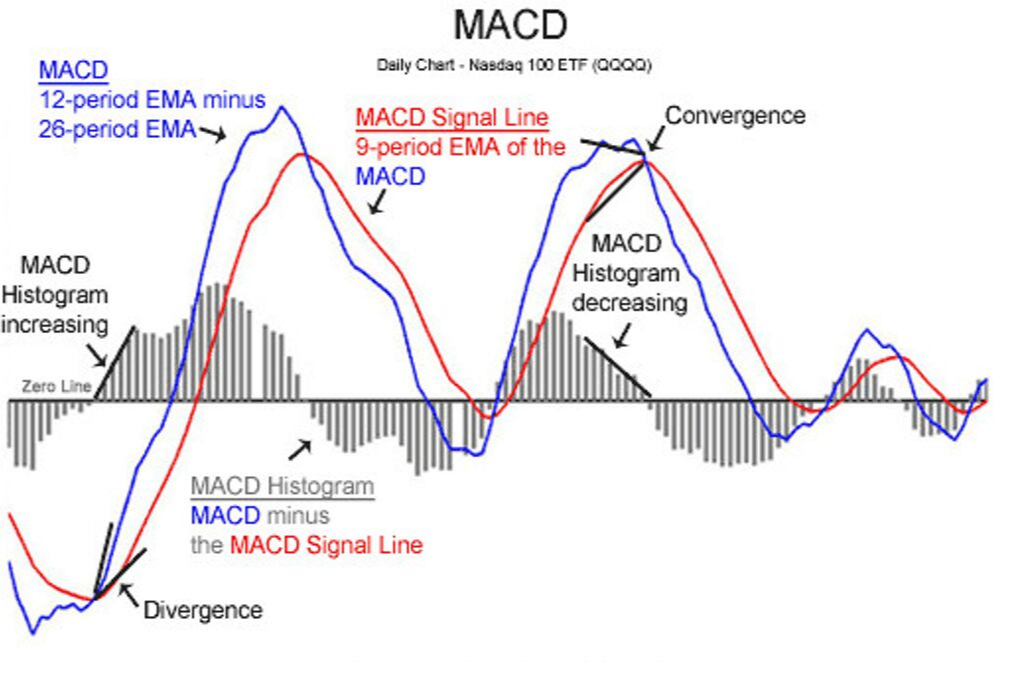
There are two essential terms in the preceding MACD histogram:
Divergence: It shows an increase in height either in a positive or negative direction. This happens because the Moving Average Convergence/Divergence is accelerating faster in the direction of the principal market trend.
Convergence: With convergence, the MACD histogram happens to diminish in height. This happens because of a change in direction or a gradual decrease in currency trend, bond or stock. When this happens, the MACD line gets closer to the Moving Average Convergence/Divergence signal line.
When a currency pair or stock is moving sturdily in a direction, the MACD histogram experiences an increase in height. Whenever the MACD histogram experiences a decrease in height instead of an increase, the market slows down, which is a sign of a possible reversal.
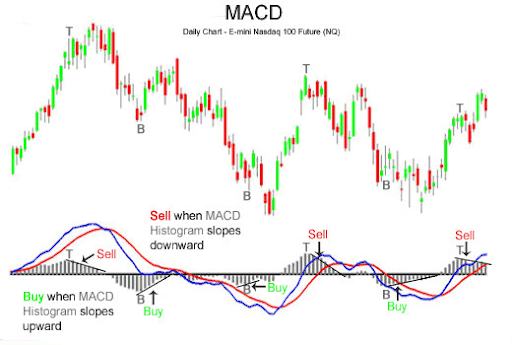
The letter T shows the peak of the Moving Average Convergence/Divergence. The letter B shows when the base of the MACD histogram has been reached. This chart shows how close the top and bottom of the MACD histogram are to the top of the Nasdaq 100 e-mini future price action.
Note
- When the MACD histogram is below the zero line and begins to converge towards the zero line, we have a potential buy signal.
- When the MACD histogram moves above the zero line and begins to converge towards the zero line, we have a potential sell signal.
The preceding example highlights three consecutive days of the decreasing MACD histogram from the peak or base, serving as possible buy or sell signals (highlighted with arrows). Traders can wait for the MACD histogram to reach zero, but it would be no different from the signal from the MACD moving average crossover.
MACD Divergences
There are two types of MACD divergences: the bullish divergence, and the bearish divergence.
Bullish divergence: The bullish divergence happens when the indicator shows that the price should be turning and moving higher, but the real price action continues on a downward trend.
Bearish trend: The bearish trend happens when an analysis indicator signifies that a price should be going down, but the currency pair or stock continues to maintain its current upward trend.
These divergences signal a trader to get out of a long or short position before profits become losses.
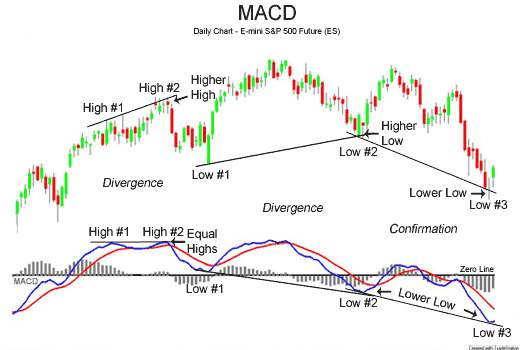
High #1 to High #2
The preceding chart shows that from High #1 to High #2, the future contract created higher highs, often known as bullish. However, the MACD moving average did not make a new high. This early warning of things to come with the E-mini S&P 500 future contract was the bearish divergence.
Low #1 to Low #2
The futures made higher lows from Low #1 to Low #2 in another bearish sign for the E-Mini S&P 500 futures contract. This is considered a positive move, even though the Moving Average Convergence/Divergence Technical indicator made lower lows from Low #1 to Low #2. This is a bearish downturn showing signals for the approaching downturn of the S&P 500 future and market.
Low #2 to Low #3
The Moving Average Convergence/Divergence can also help confirm price movements, apart from the bullish and bearish divergences. The E-mini S&P 500 futures contract made a high lower low, which was confirmed by the MACD when it also created a lower low.
Pros and Cons of Using the Moving Average Convergence/Divergence
Pros of Using the Moving Average Convergence/Divergence
The MACD indicator is reliable and straightforward, which is the main reason it is widely used today. It is popular for the two different signals it provides:
- The turning point of the trend
- The strength of the trend
The Moving Average Convergence/Divergence does not just determine the direction of a trend (up or down) but also the strength of buy and sell signals. Usually, traders might choose to use a simple moving average strategy to set their sell and buy signals, but this gauge can be delayed which means the market condition could experience a change before the execution of the trade. The moving average convergence or divergence indicator is a useful trading tool because it provides a current representation of market happenings.
Cons of Using the MACD
The MACD, as with any other indicator, is not flawless and can be used alongside other trading tools to help tackle any technical challenges. One problem with the MACD is that it is a short-term indicator, which means it cannot take long-term measurements. The longest measurement of the Moving Average Convergence/Divergence is the 26-day moving average. For a long-term outlook, the Moving Average Convergence/Divergence may not be the best choice.
Another problem with the MACD is the is the trend following indicator. This means that the signals of the indicator are given as trends come and not before. Therefore, the Moving Average Convergence/Divergence does not help if you are looking to recognise an upcoming trend.
Conclusion
The Moving Average Convergence/Divergence indicator brings together trends and momentum in one indicator; this is something that makes it special and sought after by many traders. The combination of the trend and momentum can be applied in different types of charts. The difference between the 12- and 26-period EMAs is the standard setting for Moving Average Convergence/Divergence. For more sensitivity, you can try a shorter short-term moving average and a longer long-term moving average as it is sensitive and better suited for weekly charts. If looking for less sensitivity, you may consider increasing the moving averages. The less sensitive MACD will continue to oscillate above or below zero but the signal line crossovers and the centreline crossovers will be less frequent.
The Moving Average Convergence/Divergence is not particularly good for identifying overbought and oversold levels. Even though it is possible to identify previous overbought and oversold levels, the MACD does not have any upper or lower limits to bind its movement. When there are sharp moves, the Moving Average Convergence/Divergence can extend beyond its historical extremes.
Finally, the Moving Average Convergence/Divergence line is calculated using the difference between two moving averages. This means that the values of the MACD depend on the price of the underlying security. It is not possible to compare Moving Average Convergence/Divergence values for a group of securities with varying prices.
The information provided here is for educational purposes and not trading advice. It is not a solicitation to sell or buy any commodity or Forex product. Past performance in any trend is not an indicator of a future trend; trading is all about taking informed risks. We shall not be liable for results – whether positive or negative – which come from the use of, or inability to use, the information provided in this article.