
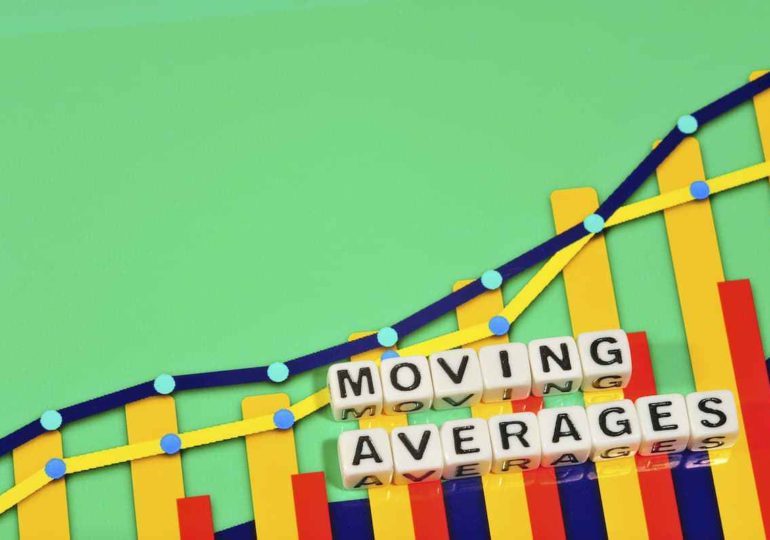
Understanding Moving Averages And Their Types
Moving averages are among the easiest and the most popular tools available to a technical analyst. They smooth out price action by separating the noise from random short-term price fluctuations. They act as building blocks for various other technical indicators as well as overlays.
Because MA’s are calculated using past prices, they are trend-lagging or trend-following indicators. The two commonly used averages are simple moving average (SMA) and exponential moving average (EMA).
The most common applications are to determine resistance and support levels and to identify the direction of the trend. While moving averages are enough to be used on their own, they form the basis of technical indicators like moving average convergence divergence, Bollinger Bands, and McClellan Oscillator.
Security can do 3 things – it can trend up, trend down, or trade in a range. When security forms a series of higher lows and higher highs, an uptrend is established. Downtrend is a situation where the security creates a series of lower highs and lower lows. When the security is neither able to establish an uptrend nor a downtrend, it is trading in range. MA’s follow the trend, and this is why they work best when a security is following a trend and are ineffective when security is moving in a trading range.
Moving averages lag behind present action, as they are built on past prices. So, the longer the time span for the moving average, the bigger will be the lag. Thus, a 100-day moving average will have a greater measure of lag as compared to a 10-day moving average, as it consists of the prices for the past 100 days.
The length of the moving average depends on the trading objectives, with long-term MA’s utilised for long-term investors and shorter moving averages more suited for short-term trading. The 200-day and 50-day MA are commonly followed by readers and investors, with breaks below and above this moving average identified as important trading signals.
They also impart crucial trading signals on their own, or when more than one average crossover. A rising moving average signifies that the security is in an uptrend, whereas a decreasing moving average shows that it is in a downtrend.
Similarly, upward movement is assured with a bullish crossover, which takes place when a longer-term moving average is crossed by an upward short-term moving average. Downward movement is signalled with a bearish crossover, which happens when a longer-term moving average is crossed by a downward short-term moving average.
Moving averages are completely customisable indicators. This means that the user can choose whatever timeframe they wish when creating the average. 15, 20, 50, 100, and 200 days are the most common time periods employed in MA’s. The average will be more sensitive to price changes if the time span is shorter, whereas the average will be less sensitive in cases of a longer time span.
Simple Moving Average (SMA)
Simple moving average is generally utilised to identify trend direction but can also be used to generate possible sell and buy signals. It is calculated by computing the average price of a security over a particular number of periods. Most moving averages are calculated using closing prices. For example, a six-day SMA is the six-day sum of closing prices divided by six.
As the name suggests, a moving average is an average that moves. The old data is ignored as the new data becomes available, making the average move along the time scale.
What does SMA tell you?
An SMA is customisable, which means that it can be computed for a different number of periods, simply by adding the security’s closing price for a number of days. An SMA evens out volatility and makes it simpler to look at the price trend of a security.
If the SMA points up, it means that the price of security is increasing. Whereas, if it is pointing down, it signals that the security’s price is reducing. SMA will be smoother if it is calculated over a longer timeframe. However, when there is no trend, SMA might give misleading signals.
Two commonly used trading patterns that employ SMAs include a golden cross or a death cross.
- A death cross takes place when the fifty-day SMA crosses below the 200 moving average. This is taken as a bearish signal, which means there are further losses in store.
- The golden cross happens when a short-term SMA breaks above a longer-term moving average, which is a bullish sign.
Analytical significance
Moving averages are a vital analytical tool employed to locate current price trends and the possibility of a change in an established trend. The easiest way of using SMA in analysis is utilising it to instantly identify if a security is in a downtrend or uptrend.
Another popular, although more complex analytical tool, is to contrast a pair of SMAs to one another covering different timeframes. For example, if a shorter-term SMA is above the longer-term SMA, an uptrend is expected. On the other hand, a longer-term average above a shorter-term SMA signals the possibility of a downtrend.
Exponential Moving Average (EMA)
EMAs reduce the lag in SMAs by applying more weight to the newer prices in comparison to the older prices. EMAs differ from SMAs in that the calculation of EMA on a given day depends on the EMA calculations for days prior to that day, so you need far more than ten days of data to compute a reasonable accurate 10-day EMA.
The weighting multiplier
A 10-period EMA applies an 18.18% weighting to the most recent price. A 10-period EMA can be called an 18.18% EMA as well. A 20-period EMA employs a 9.52% weighting to the latest price (2/(20+1) = .0952). It is noteworthy that the weighting for the shorter time span is more, as compared to the weighting for a longer period. In fact, every time the moving average time period doubles, the weighting drops by half.
Time Period = (2/percentage) – 1
3% example: Time period = (2/0.03) – 1 = 65.67 time periods.
What does EMA tell you?
The most popular and most often analysed or quoted averages are the 12 and 26-day EMAs, which are employed to form indicators, such as percentage price oscillator (PPO) and the moving average convergence divergence (MACD). Usually, the 50 and 200-day EMAs are utilised as signals of long-term trends. As a stock price cross its 200-day moving average, it indicates that reversal has occurred.
Traders who use technical analysis find MA’s very insightful and useful when applied correctly, but can create havoc in case of misinterpretation and improper application. All the moving averages that are used in technical analysis are lagging indicators. Consequently, the results drawn from employing a moving average to specific market charts should be to ensure a market move or to signal its strength.
Very often, the optimal point of entering the market has already passed by the time a moving average line has altered, to reflect a notable move in the market. An EMA does serve to relieve this dilemma to some extent. This is because EMA calculation puts more weight on the latest data and clings to the price action more tightly.
Interpreting The EMA
Moving averages indicators are more suitable for trending markets and so are EMAs. When the market is strong, the EMA indicator line will display an uptrend and vice versa in case of a downtrend. A vigilant trader will not only focus on the direction of the EMA line but also the rate of change in relation from one bar to the next.
For example, if the price action of a powerful uptrend begins to reverse and flatten, the rate of change of EMA from one bar to the next will start to decrease until the rate of change is zero and the indicator line flattens.
Simple vs Exponential Moving Average
Even though there are obvious differences between SMA and EMA, it is not necessarily true that one is better than the other. EMAs will turn before SMAs. On the other hand, SMAs display a true average of prices for the whole time period. As such, SMAs may be better suited to spot support of resistance levels.
Sometimes, the EMA reacts quickly, making the trader exit a trade on a market hiccup, while the slower moving SMA keeps the trader in trade, resulting in larger profits after the hiccup is over. The opposite could happen at other times. The faster moving exponential moving signals display trouble faster than the SMA, and so the EMA trader gets out of the loss’s way quicker, saving money and time.
Moving average preference depends on the analytical style, objectives, and time horizon. Chartists should try employing both types of MA’s and different timeframes to spot the best fit.
MA Indicators Examples
Moving Average Convergence Divergence (MACD)
MACD is used by those traders who observe the relationship between two MA’s. It is usually computed by subtracting a 26-day EMA from a 12-day EMA.
When MACD is positive, the SMA is situated above the long-term average. This indicates an upward momentum. When the short-term average is under the long-term average, it signifies downward momentum. Many traders will also look for a move below or above the zero line. A cross below zero signifies selling, while a move above zero suggests buying.
Bollinger Bands
This technical indicator has bands usually placed two standard deviations away from an SMA. Generally, a shift towards the upper band indicates that the asset is becoming overbought, whereas a move towards the lower band signals that the asset is being oversold. A Bollinger Bands indicator adjusts itself as per the market conditions, since standard deviation is utilised as a statistical measure of volatility.
Signal/Trigger Line
Moving averages can be made for any type of data that changes often. It is even possible to consider a moving average of a technical indicator like the MACD. Buy signals are developed when the value of the signal goes above the signal line, whereas short signals are formed from a cross below the signal line.
Key Takeaway
A moving average can be an effective tool to establish and confirm the trend, identify resistance and support levels, and generate trading systems.
SMA and EMA help see the trend by levelling the price movements. These two types cannot be compared – one is not necessarily better than the other. However, depending on the need of the trader, they can choose to use either or both of the two.
Moving averages will ensure that you are in line with the current trends. Yes, the trend is your friend, securities use a lot of time in a trading range, which renders MA’s ineffective. However, during a trend, the moving averages will hold you in, but also provide late signals. You must not expect to sell at the top and to buy at the bottom by only using MA’s. You should employ the moving averages with other technical tools.